Since 19-Sep’s mo failure below 137.10 discussed in 20-Sep’s Technical Blog, we’ve advised approaching this relapse as a correction and an eventual preferred risk/reward buying opportunity within what we believe is a broader base/reversal environment from 22-Jun’s 115.50 low in the then-prompt Sep contract. But the market has not only yet to stem this relapse with the requisite bullish divergence in momentum, it is engaging 06-Sep’s 126.75 key low and looks poised to break it as part of what we now believe is a resumption of the larger-degree correction from 08-Aug’s 147.25 high that we’ll expound on below.
As a result of the past couple days’ continued slide, Tue’s 133.65 high is considered the latest corrective high this market is now required to recover above to break the past couple weeks’ downtrend. In this regard that 133.65 high is considered our new key risk parameter from which long-covers and cautious bearish punts can now be objectively based and managed.
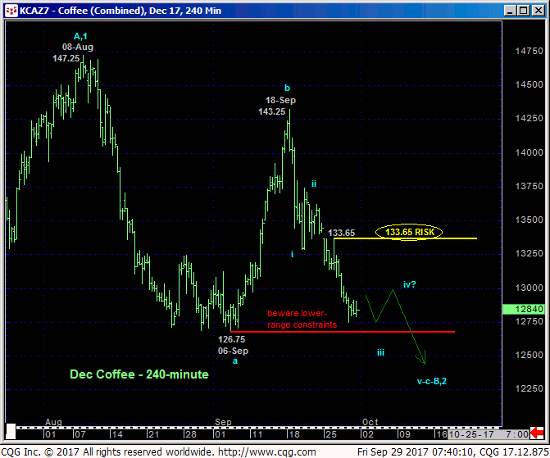
While 06-Sep’s 126.75 low and support remains intact, we can’t totally ignore the possibility that the past couple weeks’ relapse isn’t “just” a correction of early-Sep’s rally ahead of a sharp reversal higher. Given the extent of the past couple weeks’ drubbing however, we believe it’s more likely that this relapse is a continuation of the larger-degree correction of Jun-Aug’s rally that will result in a break of that 126.75 low and expose the market to an area that’s totally devoid of any technical levels of merit until Jun’s 119.10 low. Whether it’s above 126.75 or from some level below it however, the market simply needs to stem the clear and present and at least intermediate-term downtrend with a bullish divergence in momentum in order to mitigate a count calling for further losses, and losses that could be surprising in scope.
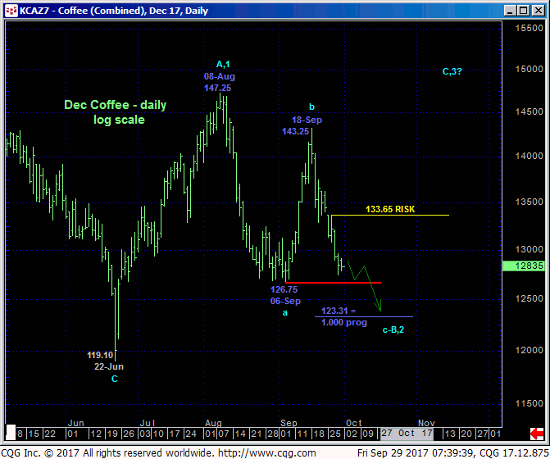
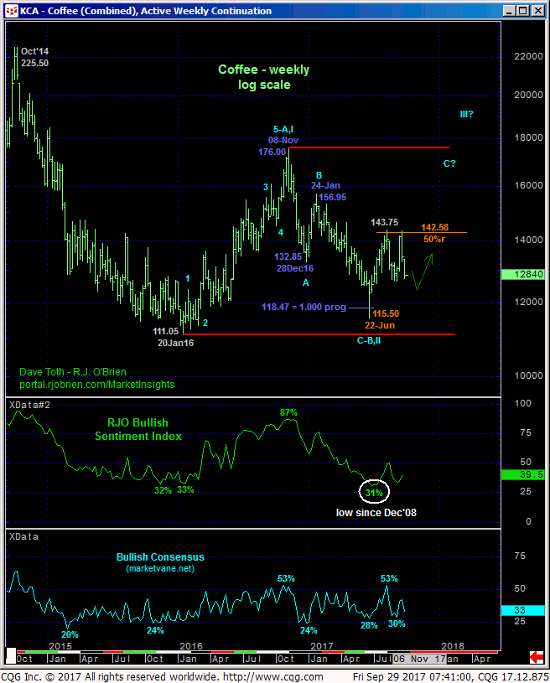
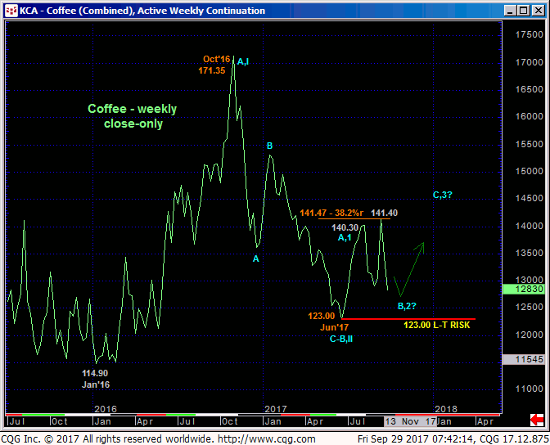
From a broader perspective shown in the weekly log chart above and weekly close-only chart below, the 3-wave decline from Oct’16 to Jun’17 stands out as a 3-wave and thus corrective affair that warns of a broader base/reversal environment. Market sentiment levels that are closer to historical lows than highs would seem to reinforce a count that suggests traders want to be looking for reasons to BUY this market, not sell it “down here” at the lower-quarter of the past couple years’ range. Nonetheless, until and unless this market stems the current decline with a bullish divergence in mo, further losses should not surprise, including a break below 06-Sep’s 126.75 low and an assault on levels ranging from the 123-handle to Jun’s 119.10 low in the Dec contract.
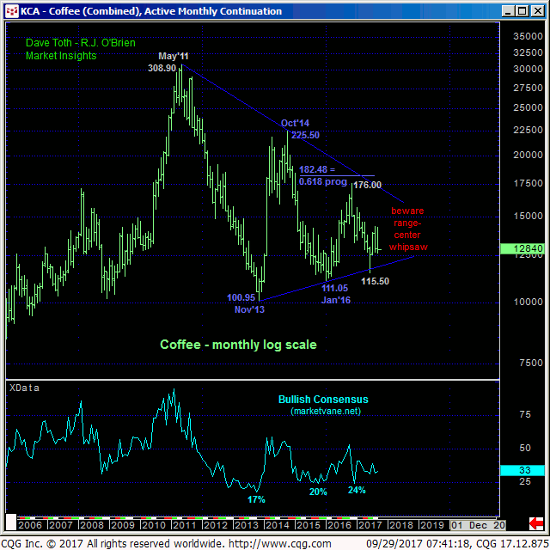
While we’ve seen some wide directional swings over the past few months that have been challenging to trade, we have discussed the higher odds of exactly such aimless and generally lateral whipsaw risk within the context of the market’s position deep into the apex of a multi-year contracting triangle pattern shown in the monthly log scale chart below. On this basis such lateral, aimless chop doesn’t come across as surprising and is relatively minor compared the multi-year range 111 to 176 or even 101 to 225. From a day-to-day or week-to-week perspective however, these swings have certainly been challenging. But such corrective, consolidative behavior is the nature of ever market beast, and it happens more often than not (we believe about 2/3rds of the time on any particular scale).
These issues considered, we believe the market is poised to break 06-Sep’s 126.75 low as part of a continuation of what we believe is the resumed correction down from 08-Aug’s 147.25 high. If correct, then at some level south of 126.75- anywhere between that low and Jun’s 119.10 low- the market needs to stem this clear and present downtrend with a confirmed bullish divergence in momentum from which a return to a bullish policy will be advised. In lieu of such a mo failure and as long as the market now sustains levels below our new risk parameter at 133.65, further and possibly steep losses are expected.
