NOV CRUDE OIL
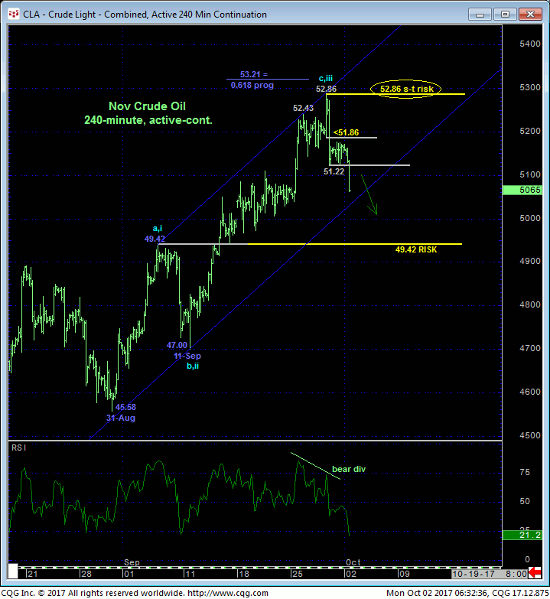
Thur late-morning’s failure below our 51.86 short-term risk parameter discussed in that morning’s Technical Blog confirms a bearish divergence in short-term momentum that stems at least the portion of Sep’s uptrend from 11-Sep’s 47.00 low and exposes a correction or reversal lower. Overnight’s continued break below Thur’s 51.22 initial counter-trend low reaffirms this weakness and solidifies Thur’s 52.86 high as one of developing importance and our new short-term risk parameter from which non-bullish decisions like long-covers and cautious bearish punts can be objectively based and managed.
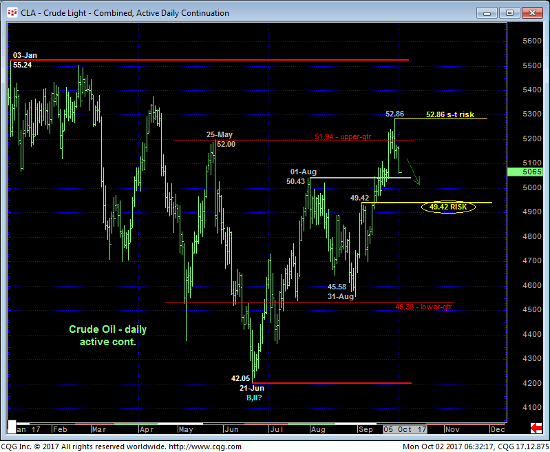
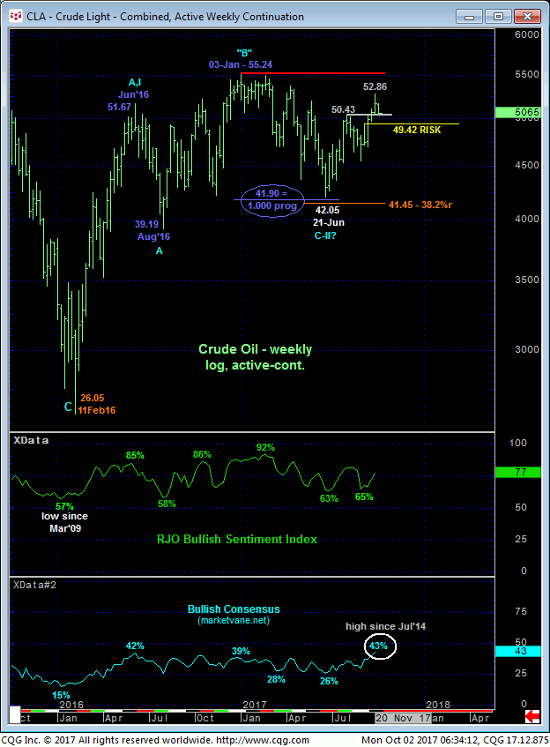
From a longer-term perspective the market hasn’t weakened enough these past few days to conclude a more significant peak and reversal lower. The market’s rejection of the upper-quarter of the past year’s range amidst the highest (43%) Bullish Consensus (marketvane.net) reading since Jul’14 are factors that warn of just such a larger-degree, if intra-range, vulnerability. Early-Aug’s former 50.43-area resistance cannot be ignored as a new support candidate within the past quarter’s still-arguable and major uptrend. Nonetheless, the factors cited above and the magnitude of the past year’s mere lateral chop warns of lateral-to-lower prices in the period ahead that we believe warrants a neutral-to-cautiously-bearish policy.
These issues concerned, traders have been advised to move to the sidelines. Proof of labored, corrective behavior up into suspected resistance from the 51.25-area would be cause to consider new cautious bearish exposure following a bearish divergence in short-term mo needed to stem that recovery attempt.
NOV HEATING OIL
Overnight’s momentum failure below our short-term risk parameter at 1.7969 stems the rally from at least 11-Sep’s 1.7227 low and is cause for shorter-term traders to move to the sidelines and even longer-term players to [are bullish exposure to more conservative levels. As a result of this short-term weakness the market has identified last week’s 1.8586 high as one of developing importance and our new short-term risk parameter from which non-bullish decisions like long-covers and cautious bearish punts can be objectively based and managed.
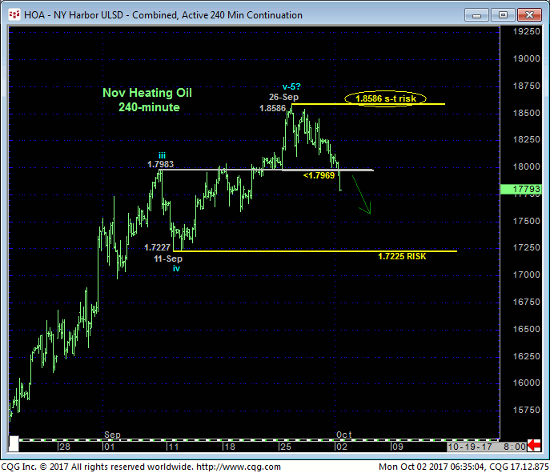
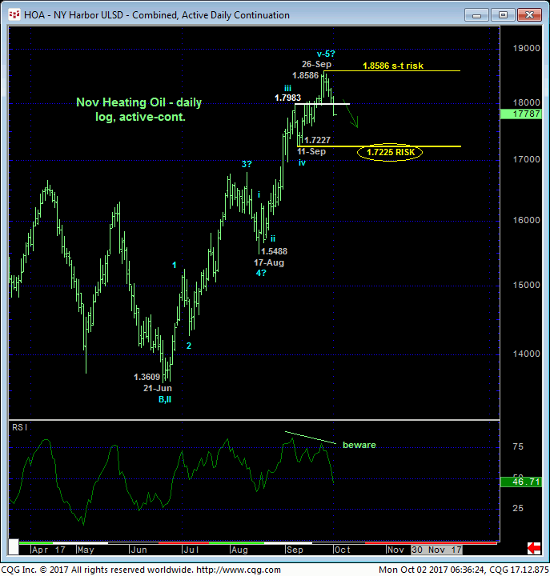
From a longer-term perspective however, commensurately larger-degree weakness below 11-Sep’s 1.7227 next larger-degree corrective low and our long-term risk parameter remains required to threaten our long-term bullish count discussed in 26-Sep’s Technical Blog. Indeed, last week’s rally reached a new high for a major reversal that dates from Jan’16’s 0.8538 low, and no mere intra-day momentum failure will ever suffice in concluding a major peak/reversal environment.
Might last week’s 1.8586 high have completed a 5-wave Elliott sequence up from 21-Jun’s 1.3609 low as labeled in the daily log scale chart above? Sure. But there would be no reinforcing proof of such in the absence of a commensurately larger-degree momentum failure below our long-term risk parameter at 1.7225. The market remains above former and major 1.7650-area resistance from Jan that, since broken over the past few weeks, must first be approached as a major new support candidate. A failure below 1.7225 would provide more legitimate evidence on weakness and vulnerability on a gander scale.
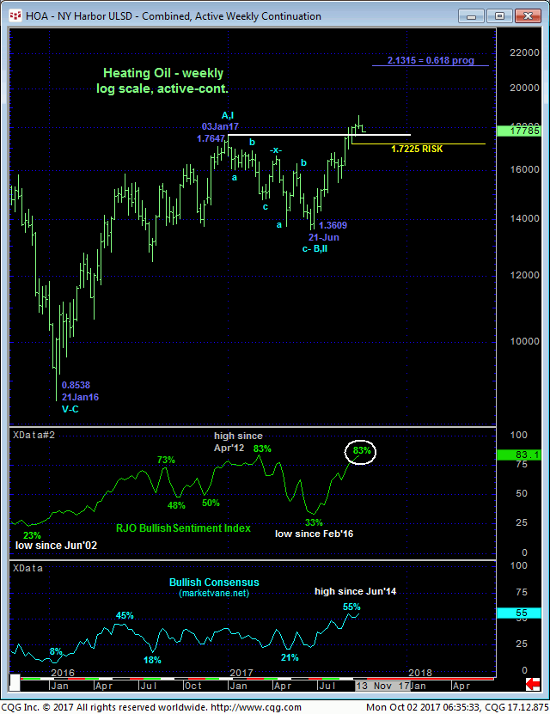
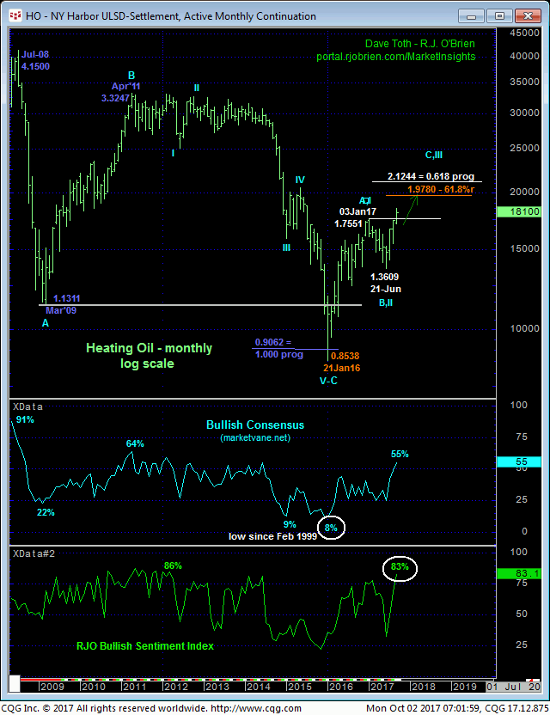
Contributing to a larger-degree peak/reversal-threat environment however is market sentiment. The weekly (above) and monthly (below) log scale charts show both the Bullish Consensus (marketvane.net) and our RJO Bullish Sentiment Index at levels that have warned of and accompanied major peak/reversal conditions in the past and could be doing so again.
These issues considered, shorter-term traders have been advised to move to a neutral/sideline position while longer-term players have been advised to pare bullish exposure to more conservative levels. Further weakness below 1.7225 remains required for longer-term players to jettison this exposure altogether however. If the market has something bigger to the bear side in store, we would look for reinforcing evidence in the form of labored, 3-wave, corrective behavior on recovery attempts that will provide preferred risk/reward selling conditions.
