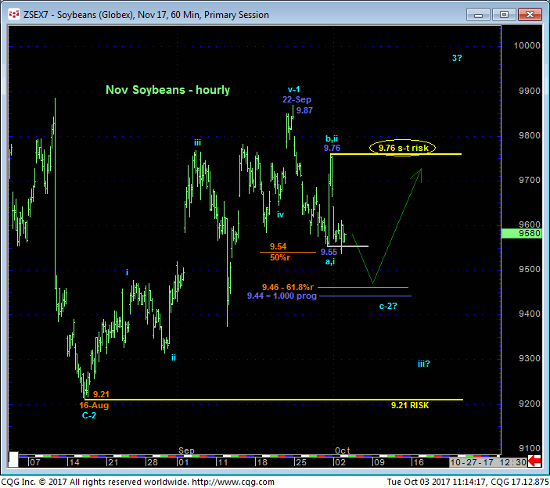
In last Wed’s Technical Webcast we discussed the developing prospect of a correction lower within what we believe is a broader BASE/reversal-threat environment. Today’s slip below Fri’s 9.55 initial counter-trend low reaffirms this count and, most importantly, leaves Fri’s 9.76 high in its wake as the latest smaller-degree corrective high this market is now required to sustain losses below IF the market has something broader to the bear side in mind. A recovery above 9.76 would render the relapse attempt from 22-Sep’s 9.87 high a 3-wave and thus corrective structure consistent with a broader bullish count. In this regard 9.76 becomes our new short-term risk parameter from which non-bullish decisions like long-covers and cautious bearish punts can be objectively rebased and managed.
If our preferred (bullish) count is correct and current relapse is indeed just a correction, traders are advised to watch for a bullish divergence in short-term momentum needed to arrest this relapse and identify a more reliable low and support from which the risk of a bullish play can only then be objectively based and managed. And as for lower levels to beware such a prerequisite, we’re watching the 9.46-to-9.44-area. These levels represent the 61.8% retrace of Aug-Sep’s 9.21 – 9.87 rally and the 1.000 progression of late-Sep’s initial 9.87 – 9.55 decline from Fri’s 9.76 reactive high.
While this pair of derived Fibonacci relationships is interesting, traders are reminded that we NEVER RELY on any such derived level without an accompanying bullish (in this case) divergence in momentum needed to, in fact, stem the clear and present intermediate-term downtrend.
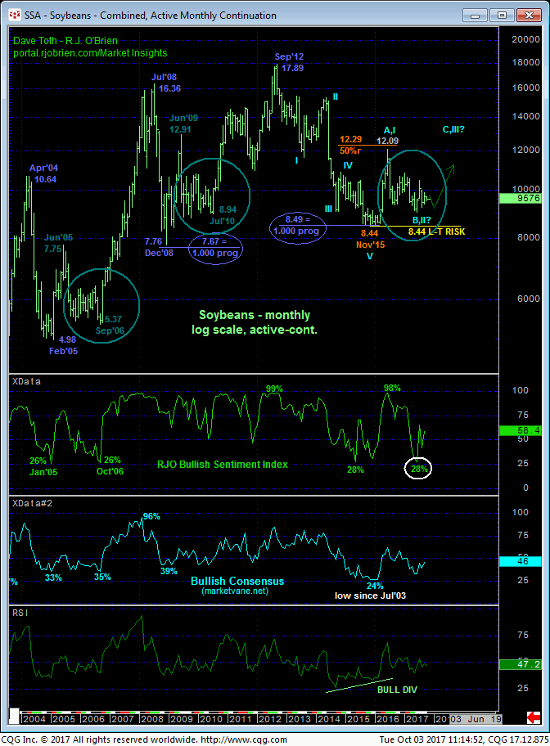
From a longer-term perspective our major base/reversal count remains predicated on:
- the market’s continued rejection of the lower-quarter of the 8.44 – 12.09-range that has been THE DOMINANT technical factor for THREE YEARS
- a “rounding-bottom” reversal pattern from that lower quarter amidst
- historically bearish sentiment accompanying Jun’s 9.00 low that remains THE low this market needs to break to threaten this count.
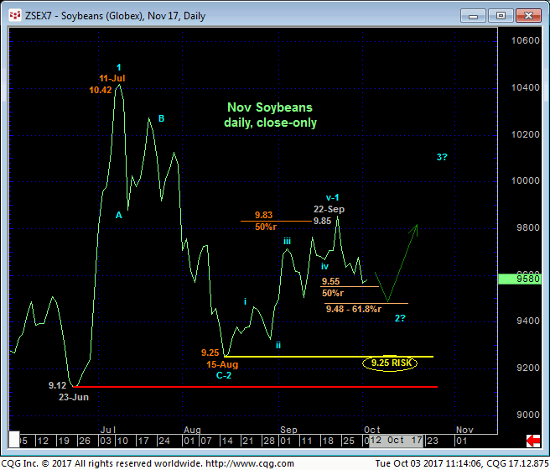
Actually, the long-term bull risk parameter can be as tight as 16-Aug’s 9.21 low on an intra-day basis and/or 15-Aug’s 9.25 low close shown in the daily close-only chart above. The 5-wave rally from that low to 22-Sep’s 9.85 high in the daily close-only chart above also reinforces this base/reversal count due to its trendy, impulsive nature. This is one of our three reversal requirements, with another key requirement being proof of 3-wave corrective behavior on a subsequent relapse attempt, or exactly the issue we discussed in the hourly chart above and the importance of the 9.46-to-9.44-area and especially Fri’s 9.76 corrective high and short-term risk parameter.
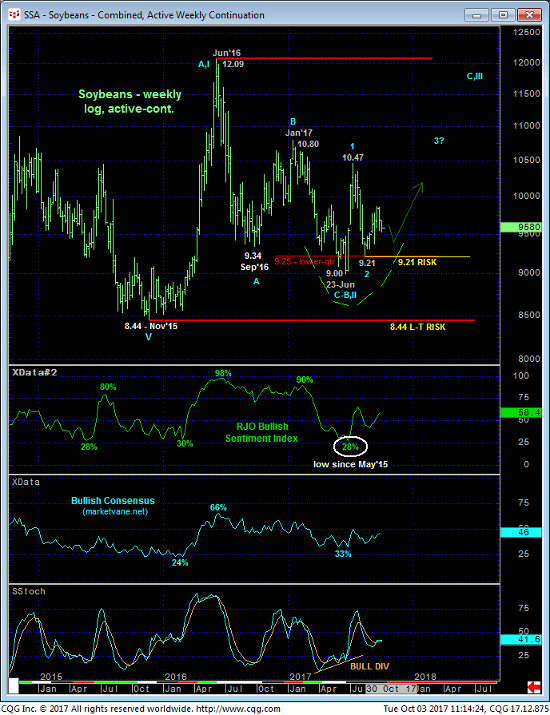
Finally, traders are reminded that until the market breaks Nov’15’s 8.44 low, that low remains in place as THE 5TH-WAVE END of the secular bear market from Sep’12’s 17.89 all-time high. The subsequent base/reversal price action thus far looks virtually identical to the major base/reversal PROCESSES that followed both Dec’08’s 7.76 low and Feb’05’s 4.98 low. We also still find it just a little short of mind-blowing that the 2012 – 2015 bear spanned an identical length (i.e. 1.000 progression) to both the 2008 AND 2004-05 bear markets on this log scale basis. This also would seem to contribute to such a major base/reversal count.
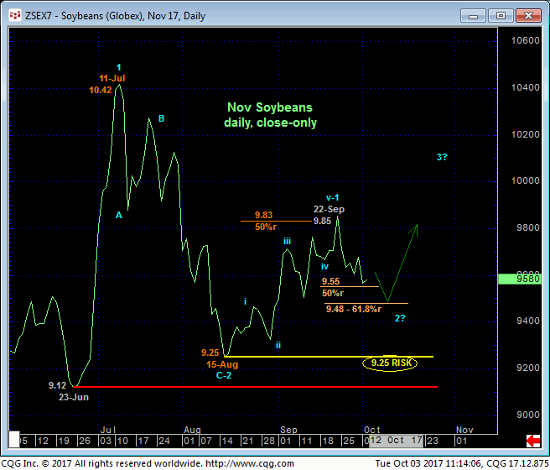
Getting back to recent prices, if this long-term base/reversal count is wrong, then all the bear needs to do is trend lower and break at least the mid-Aug low; 9.25-to-9.21. If all this thing can muster up is a little more slippage to the 9.45-area before a bullish divergence in short-term mo stifles it, we will take this as reinforcing of not only shorter-term strength, but shorter-term strength that’s a sub-component of a broader base/reversal environment that could be major in scope. In general and “down here” we want to be finding reasons to BUY this market, not sell it, for the long haul. For the time being however and as long as the market remains below 9.76, we anticipate further lateral-to-lower prices and will be watchful for a bullish divergence in mo from the 9.45-area to turn the directional scales higher once again, and possibly in a very significant way.
