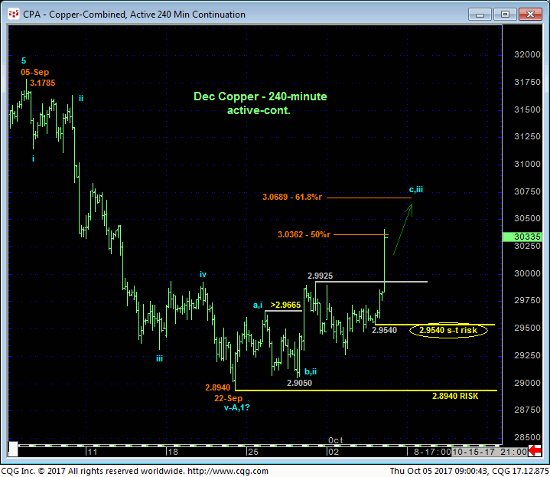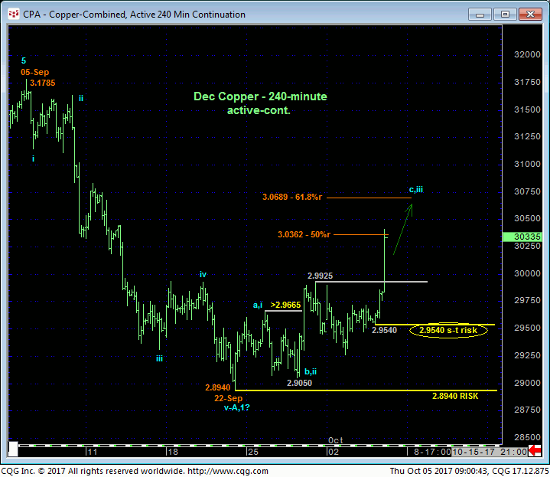
Today’s impressive, impulsive spike above 29-Sep’s 2.9925 high reaffirms the developing recovery from 22-Sep’s 2.8940 low and our bullish recommendation from 2.9500 OB in 29-Sep’s Trading Strategies Blog. As a direct result of this resumed and accelerated rally, the 240-min chart below shows that the market has identified today’s 2.9540 low as the latest smaller-degree corrective low it now needs to sustain gains above to maintain the impulsive integrity of a more immediate bullish count. Per such 2.9540 is considered our new short-term risk parameter from which such a bullish policy and exposure can be objectively rebased and managed.


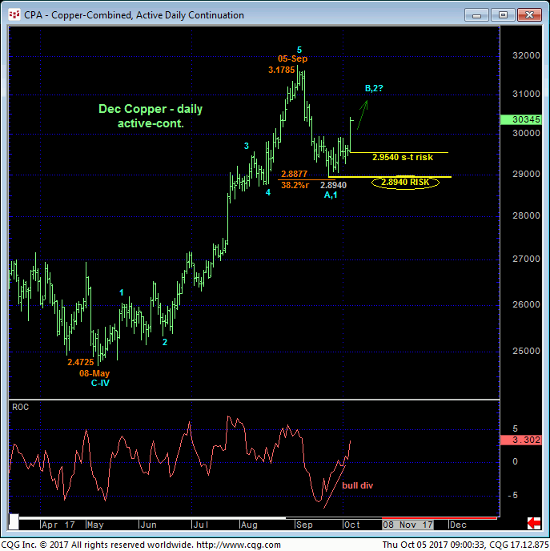
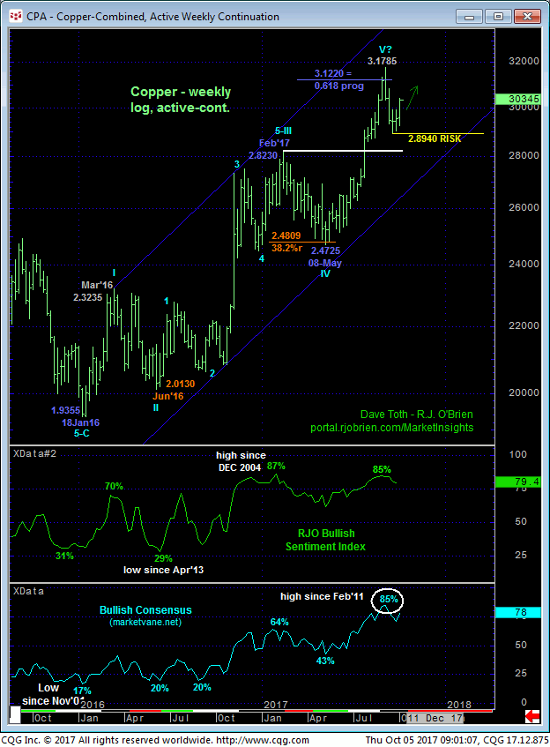
While the intermediate-term trend is definitely up and should not surprise by its continuance, the longer-term directional jury remains out as to whether Sep’s 38.2% retrace of May-Sep’s 2.4725 – 3.1785 rally is a complete correction ahead of the broader bull’s resumption OR the initial (A- or 1st-Wave) decline within a peak/reversal process that could be relatively major in scope. Indeed, the rally from Jan’16’s 1.9355 low to 05Sep17’s 3.1785 high is arguably a complete, even textbook 5-wave Elliott sequence as labeled in the weekly log scale chart below. Recent historically frothy bullish sentiment would seem to reinforce such a peak/reversal-threat count.
Conversely and without reinforcing weakness below 22-Sep’s 2.8940 low and key long-term risk parameter, the secular uptrend/up-channel remains intact and could resume to new highs above 3.1785. Sep’s 38.2% retrace of “enough” to conclude that 05-Sep’s 3.1785 high COMPLETED the rally from 08-May’s 2.4725 low. But this same Sep relapse is grossly insufficient to conclude the end of the 20-MONTH uptrend from Jan’16’s 1.9355 low, so we can’t ignore the possibility that the secular uptrend is still intact and this thing won’t go zinging off to new highs above 3.18.

IF a peak/reversal process is in progress, then by definition we would expect the market to stem the clear and present intermediate-term uptrend with a bearish divergence somewhere south of 05-Sep’s 3.1785 high. We have marked the 50% (3.0362) and 61.8% (3.0689) retraces of Sep’s 3.1785 – 2.8940 decline as guidelines/levels of interest around which to be watchful for the requisite bearish divergence in momentum needed to stem this recovery and reject/define a more reliable high from which non-bullish decisions like long-covers and cautious bearish punts can only then be objectively based and managed. In lieu of such a mo failure further and possibly accelerated gains should not surprise.
In sum, a bullish policy and exposure from 2.9500 OB remain advised with a failure below 2.9540 currently required to negate this call and warrant its cover. In lieu of such further and possibly accelerated gains are anticipated.


