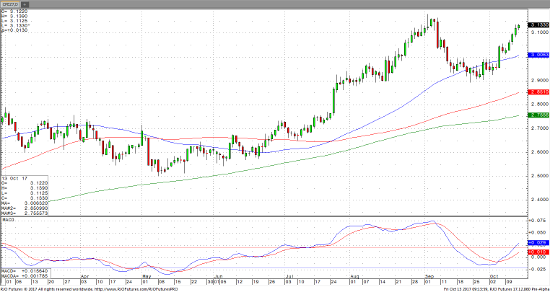
Copper futures continue to close in on the 52 week high at $3.17/lb. and are up 25% on the year after reversing off $2.90/lb 1 month ago. A recent release of Chinese trade figures indicate that strong economy should continue to expand resulting in improved import demand for basic commodities. U.S. economic conditions also have been continuing to show signs of strength. Remember that China represents 15% of global GDP and the U.S. 24%, so these are the two most important countries to watch while trading copper. As far as positioning is concerned in the markets, speculators continue to pile in on the long side as near record levels. Watch out for a short covering blow off top at $3.20/lb.
Below is a daily chart showing the near term record high and the strength of the recent move.
Dec ’17 Copper Daily Chart


