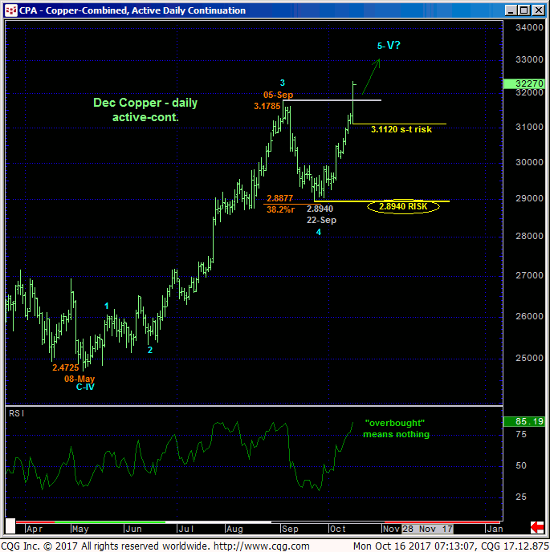
Today’s impressive, impulsive break above 05-Sep’s 3.1785 high reinstates the secular uptrend and provides an excellent example of why the third of our three reversal indicators- proof of corrective behavior on a subsequent recovery attempt- is so important. The combination of early-Sep’s bearish divergence in momentum amidst frothy bullish sentiment and a trendy, 5-wave decline from 05-Sep’s 3.17685 high to 22-Sep’s 2.8940 low was a powerful one that warned of a peak/reversal threat that could be major in scope. We recommended a bullish play from 2.9500 OB in 29-Sep’s Trading Strategies Blog looking for at least an interim B- or 2nd-Wavbe recovery, and possibly a resumption of the secular bull. This bullish policy remains in force with a failure below at least today’s 3.1120 smaller-degree corrective low and shorter-term risk parameter required to defer or threaten the bull and warrant long covers. To negate the 21-month secular bull commensurately larger-degree weakness below 22-Sep’s 2.8940 larger-degree corrective low and key risk parameter remains required.

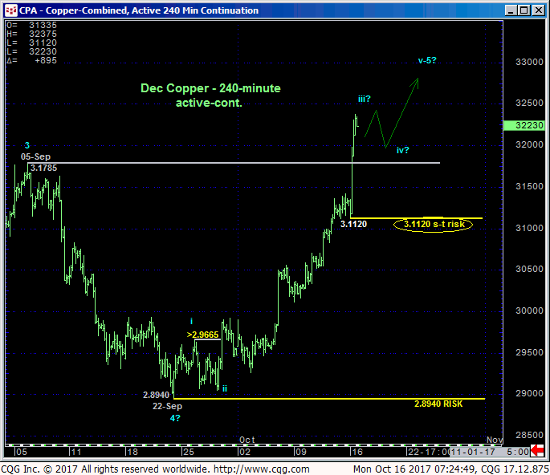
The 240-min chart below details the past three weeks’ impulsive uptrend that appears to be accelerating in true “3rd-wave-style” that warns of at least a (4th-wave) corrective slowdown and resumed (5th-wave) gasp before the threat of a larger-degree correction or reversal lower is realized. Former 3.17-handle-area resistance is considered new near-term support per any broader bullish count.


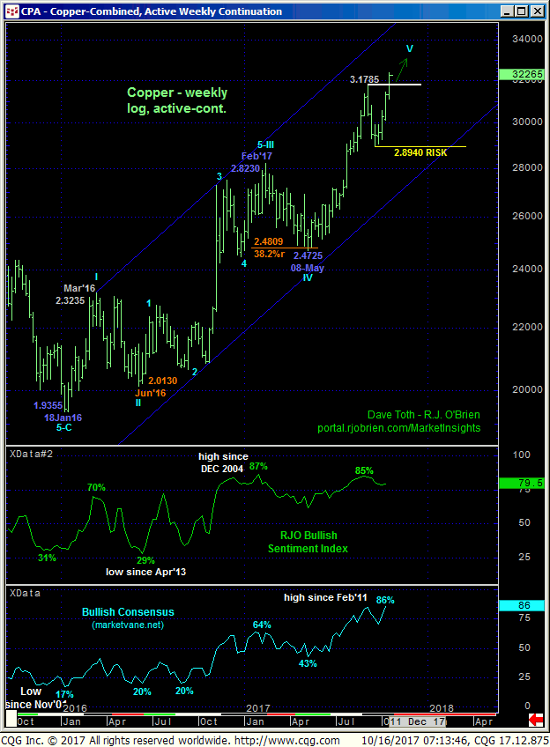
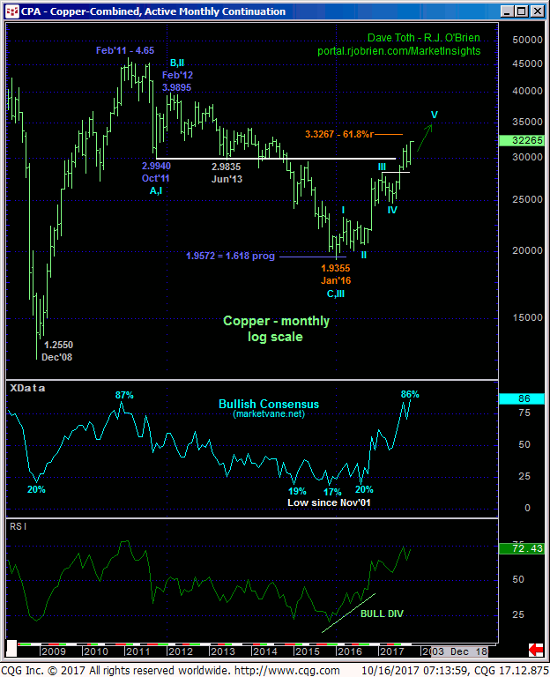
The secular uptrend is clear and present in the weekly (above) and monthly (below) log scale charts that also show both market sentiment indicators we monitor closely at frothy levels typical of major peak/reversal environments. But as the bull has been reinstated with new highs, traders are reminded that sentiment is not an APPLICABLE technical tool in the absence of a confirmed bearish divergence in momentum needed to stem the uptrend, even on a short-term basis like on a failure below 3.1120. In lieu of such a failure the trend is up on all scales and is expected to continue and perhaps accelerate.
These issues considered, a bullish policy and longs from 2.9500 OB are advised to be maintained with a failure below 3.1120 required to take profits on longs and move to the sidelines. In lieu of such weakness further gains remain anticipated with the market’s upside potential considered indeterminable and potentially steep.


