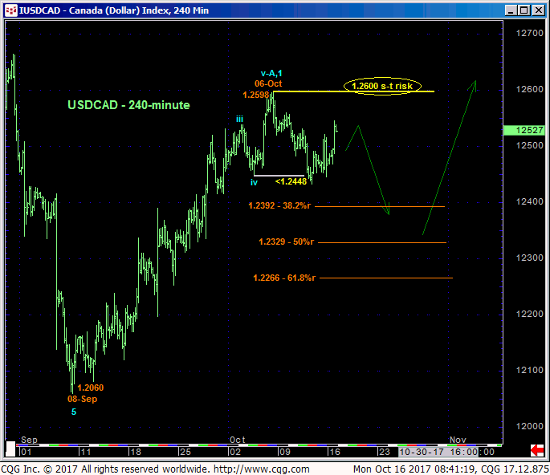
The market’s failure Wed below 04-Oct’s 1.2448 corrective low and short-term risk parameter we identified in 06-Oct’s Technical Blog confirms a bearish divergence in momentum and leaves that day’s 1.2598 high in its wake as the END of a 5-Wave Elliott sequence from 08-Sep’s 1.2060 low from which non-bullish decisions like long-covers can be objectively based and managed. We are considering 1.2600 as our new short-term risk parameter. Against the backdrop of what we believe is a MAJOR BASE/reversal environment however, traders are advised to first approach expected lateral-to-lower prices in the period ahead as a corrective buying opportunity that could have long-term implications.


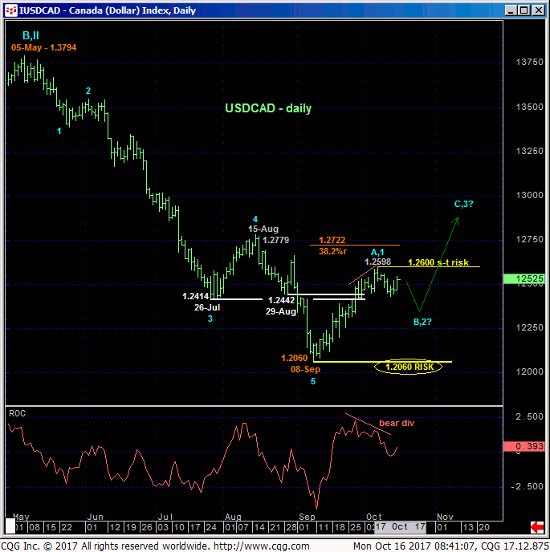
The daily chart above shows the bearish divergence in momentum that breaks the recent rally and exposes a move lower as long as that 1.2598 high remains intact. From a long-term perspective however we believe a major base/reversal environment is at hand. This environment is predicated on:
- the market’s failure thus far to sustain late-Aug/early-Sep losses below key 1.24-handle-area support-turned-resistance
- an arguably complete 5-wave Elliott sequence down from May’s 1.3794 high amidst
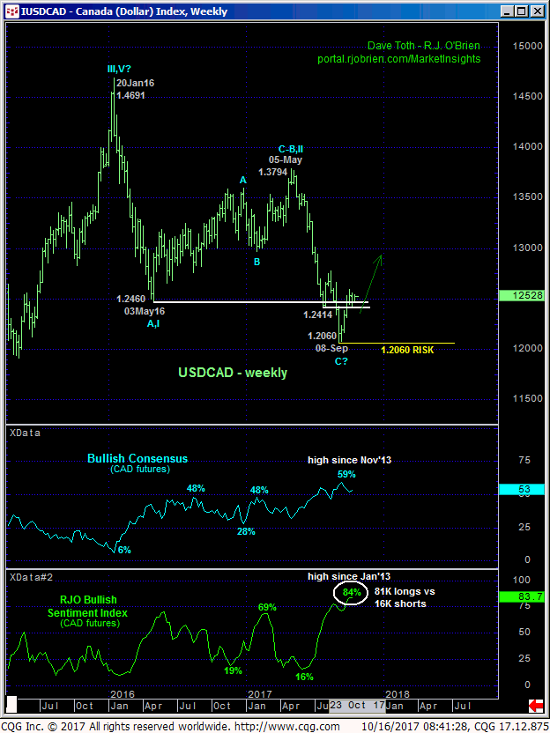
- historically frothy and even stubborn bullish sentiment levels DESPITE Sep-Oct’s 1.2060 – 1.2598 rally.

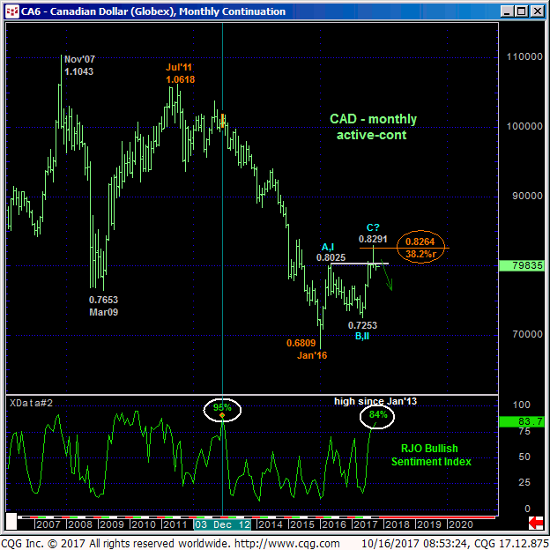
Indeed, the current 84% reading in our RJO Bullish Sentiment Index is the most egregious amount of bullishness by the Managed Money community in nearly FIVE YEARS and has even moved higher despite the Sep-Oct decline in the CAD contract shown in the monthly active-continuation chart below. Combined with the bullet points listed above and Fibonacci fact that the 2016-17 recovery attempt stalled within ticks of the (0.8264) 38.2% retrace of the entire 2011 – 2016 decline from 1.0618 to 0.6809 in the contract, it’s not hard to find technical facts that warn of a major peak/reversal threat in the contract and base/reversal threat in the cash USDCAD.
These issues considered, long-term players remain advised to maintain a bullish policy and exposure with a failure below 1.2060 required to negate this call. Shorter-term traders have been advised to move to a neutral/sideline position for the time being ahead of what we believe is an interim correction lower within the broader base/reversal PROCESS. Following a bullish divergence in short-term mo from 1.2330-area prices or lower and/or resumed strength above 1.2600, traders are advised to re-establish bullish-USD exposure ahead of what could be steep, even relentless gains thereafter.


