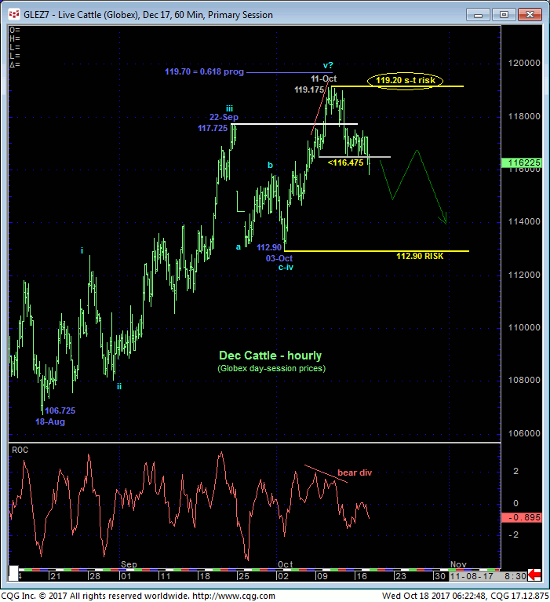
In 11-Oct’s Technical Blog we identified 09-Oct’s 116.475 low as our short-term risk parameter the market needed to sustain gains above to maintain a more immediate bullish count. Its failure to do so yesterday not only confirms a bearish divergence in short-term momentum, but also threatens a broader peak/reversal threat for longer-term reasons we’ll address below. As a direct result of this admittedly short-term mo failure, we believe the market has defined 11-Oct’s 119.175 high as the END of a 5-wave Elliott sequence from 18-Aug’s 106.725 low and start of at least a significant correction, and possible reversal of the entire Aug-Oct rally. Per such, 119.20 is considered our new short-term risk parameter from which all non-bullish decisions like long-covers and cautious bearish punts can now be objectively based and managed.


We’re placing a higher degree of importance on an admittedly short-term mo failure because of the confluence of factors that warn of a larger-degree, if intra-2017-range correction or reversal lower. These factors include:
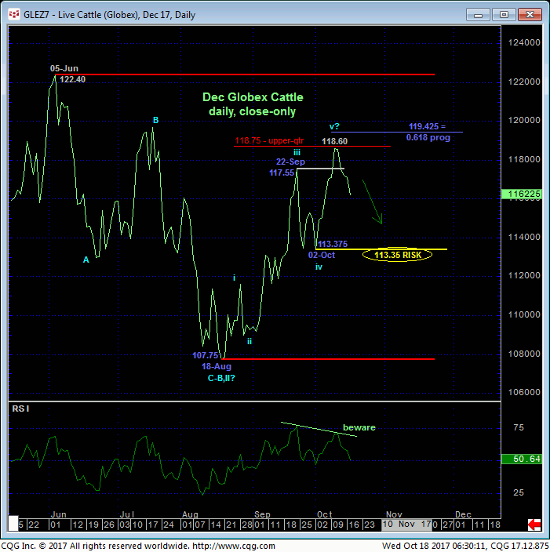
- again, the prospect that the entire Aug-Oct rally is a complete 5-wave Elliott sequence as labeled in the hourly chart (top) and daily close-only chart above
- the market’s rejection thus far of the upper-quarter of this year’s 122.- 108-range amidst waning upside momentum and, most indictingly,
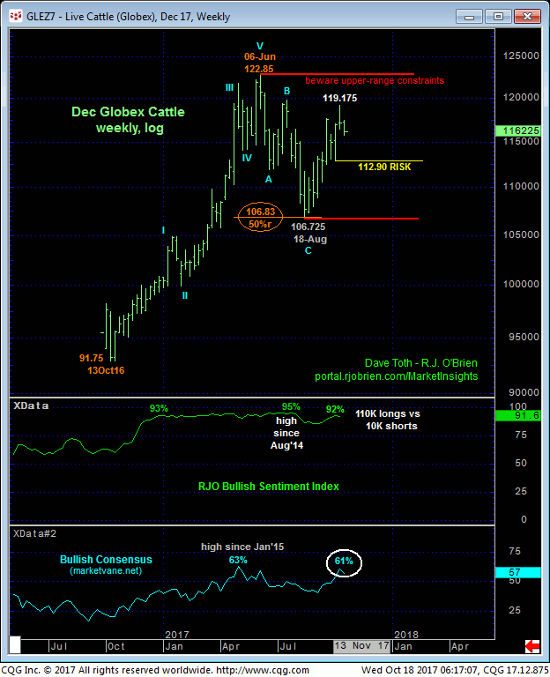
- historically frothy bullish sentiment levels shown in the weekly log scale chart of the Dec contract below.
Indeed, at a current 92% reading reflecting a whopping 110K Managed Money long positions reportable to the CFTC versus only 10K shorts, it’s not hard to find fuel for downside vulnerability. Critics might argue that, earlier this year, this market easily sustained such frothy sentiment while the market rallied from 100 to 122. And they’d be correct. For as we always discuss, referencing a market as “overbought” either for sentiment or momentum reasons has always been and will always remain a ridiculous and irresponsible technical description of a market unless accompanied by a CONFIRMED momentum failure below a prior corrective low (in a bull’s case) needed to, in fact, break the simple uptrend pattern of higher highs and higher lows.
This year’s first-half uptrend wasn’t broken on this weekly scale until 19-Jun’s failure below 11-May’s 114.05 low in the Dec contract. That initial counter-trend break was followed by a (B-Wave) correction within a typical broader peak/reversal process. Frothy bullish sentiment simply did not matter until the market broke the uptrend.
Critics might also suggest that yesterday’s short-term mo failure is of an insufficient scale to conclude the end of a 5-wave uptrend from mid-Aug’s low. They’d be correct here too as commensurately larger-degree weakness below 03-Oct’s 112.90 intra-day low (or below 02-Oct’s 113.35 corrective low close) remains required to, in fact, break the 2-month uptrend. But given the peak/reversal threats bullet-pointed above and a market-defined high and resistance at 119.20 from which any non-bullish decisions can be objectively based and managed, we believe there is sound basis to change from what has been a bullish policy since late-Aug and move to a new cautious bearish policy.

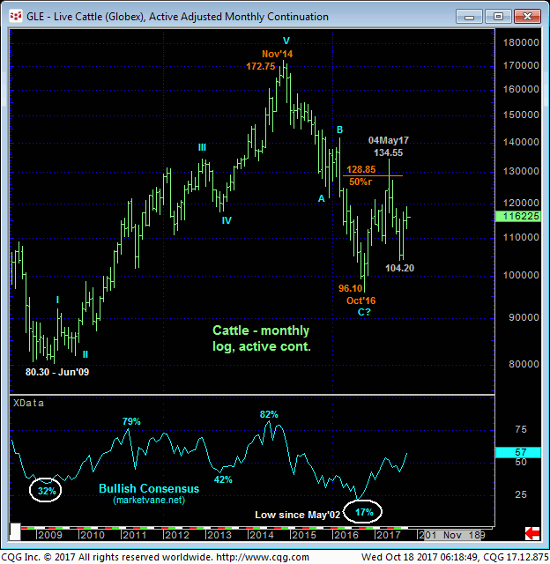
Finally, the monthly log scale chart of the most active futures contract below has arguably been in a broader BASE/reversal environment since Oct’16’s 96.10 low that could ultimately produce levels above 135 in the years ahead as long as that 96.10 low holds. But the current fact of the matter is that the market is pretty much dead center of this year’s range, and such range-center environs are typically fertile ground for aimless whipsaw risk that we believe warrants a more conservative approach to risk assumption. Herein lies more rationale for being attuned to a smaller-degree momentum failure that could morph into a more significant, if intra-range relapse.
These issues considered, traders are advised to neutralize all previously recommended bullish exposure if they haven’t already done so, and next approach recovery attempts to 117.90 OB as corrective selling opportunities with a recovery above 119.20 required to negate this call, reinstate the bull and expose perhaps sharps gains. In lieu of such 119.20+ strength we anticipate a more protracted correction or reversal of the past couple months’ rally that could span weeks or even months and include a run at the lower-quarter of the range around 111.50 or lower.


