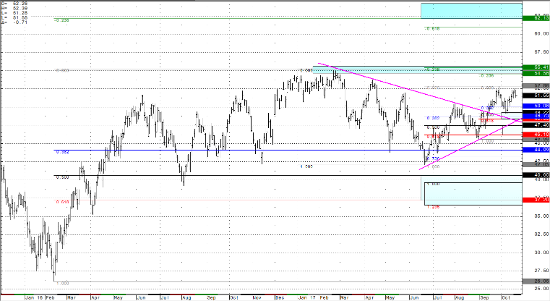
Crude oil futures have now rolled into the December ’17 contract, and the Daily Continuation Chart continues to show a market that is relatively range bound even though price action is forming a constructive pattern of higher highs, and higher lows. These “stair steps” higher are breaking above downward sloping trend lines drawn against the February, April, May, and August highs, as well as holding above upward sloping trend lines drawn against June and August lows. This technical picture is added to by two supportive Fibonacci zones (50% lines) at 49.22 and 47.46, which should find a cluster of buyers utilizing these tools.
The most recent EIA Petroleum Status report (10/18/17) saw a drawdown of -5.7 million barrels, which was higher than expectations and over double last week’s release of -2.7 million barrels. This report is considered bullish for trade, and is a main fundamental factor supporting price in the market. Crude oil imports also fell 134,000 barrels to 7.5 million barrels, which brings the 4-week average to 7.4 million barrels per day. This is 1.9% below last year for the same time frame.
In my opinion, crude oil futures have been committed to range bound price action between the $40 and $60 handles. While this range continues, it will be important to watch the smaller time frame charts for changes in intermediary trends which will cause this market to trade between the high end and low end of its range. With that being said, I am expecting support for crude in the near term while above $51.00, to take us towards $54.00. If price action breaks below $51.00, the next major support will be into the $48.00 area, and I will be expecting the market to then trade higher to test the $55.00 threshold.
Crude Light Daily Continuation Chart


