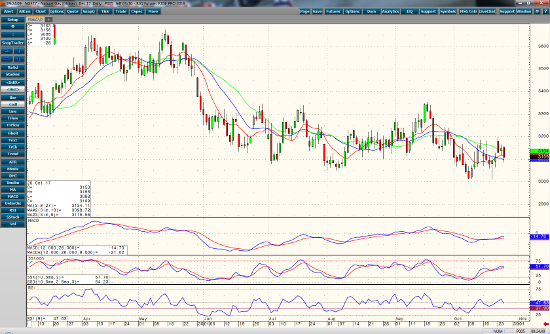
The trend in December natural gas is currently sideways to down. It is down 33 ticks at 3.049. Monday’s rally was held by the 3.200 level which leads me to believe it has reached a short term lull in trading. Momentum indicators are at mid-levels and turning south, and the moving averages are turning downward too. A close above the resistance around 3.200 would be needed to turn the trend to positive. A close beneath 3.100 may signal a sell off to lower range where 3.100 becomes resistance and support kicks in 3.020-3.040.
Support for the December gas contract continues from below normal temperatures in the most of the continental United States moving into the beginning of November, according to David Hightower of the Hightower report. The demand for heating will continue to increase with winter rapidly approaching.
Tightening down stops on any short positions is recommended, but staying exposed to the short side until the markets tells me differently is advised. Any options should be monitored closely because of decaying time value. I’ll be trying to squeeze few more points from the short positions.
Dec ’17 Natural Gas Daily Chart


