Yesterday’s EIA Petroleum Status Report saw a small increase in inventories (0.9 million barrels) marking a return to normal production levels in the gulf of Mexico as the market weighs pre-hurricane and post-hurricane numbers, which have also affected crude oil’s byproduct markets and may present opportunities in the crack spread being evaluated on our desk. The market also caught a bid after reports that Saudi Crown Prince Mohammed bin Salman backed OPEC production cuts/current quotas, possibly signaling the outlook of OPEC as a whole and in the future. There is also the factor of price levels and profitable shale production.
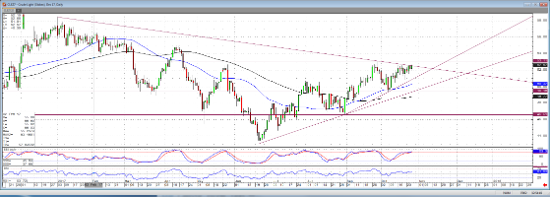
Looking at the daily chart in December oil, we see that while maintaining a wide range for most of the year, the trend has been upward since June’s low. While it is easy to see a reversion to the means below oil’s current price, there also seems to be little resistance should the previous highs in the contract be taken out. Absent trading below the $49.48 level, which would seem to nullify the current uptrend, trade above the $53.11 high of late September could see an acceleration of the current uptrend. In Thursday afternoon’s trade, the market is trading less than 50 cents (per barrel) from this level.
Dec ’17 Crude Oil Daily Chart


