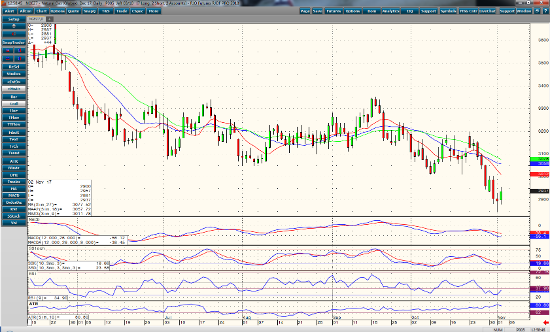
The short term trend in Dec natural gas has turned sideways to up, with a higher high and a higher low. Momentum studies are moving from oversold levels to mid range, which should help prices with continued buying. The 9, 18, and 27-day moving averages are beginning to turn up as well, supporting the idea of an uptrend. Resistance is still seen near the all important $3.000 price level, and $2.900 is still close in support. Again, a close above $3.000 may signal a higher trading range. It seems every .10 denotes a range boundary.
The storage number came in almost precisely at 65 bcf, with the expected infusion at 63 bcf. The market didn’t range wildly after the announcement. Average to below temperatures are forecast for most of the continental United States. Some of the southern states are still expecting an above average forecast, but the remaining time for that is dwindling. On the demand side, Mexico is set to put a number of pipelines into use early in the first quarter of next year. This can bring new buying pressure into the equation. Again, long exposure warrants strong consideration, either with call options or long contracts.
Dec ’17 Natural Gas Daily Chart


