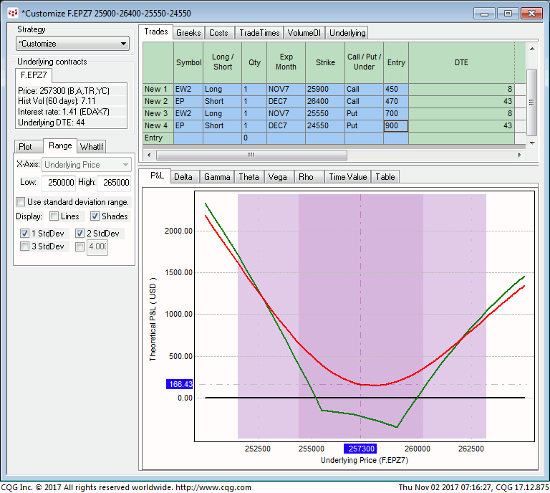
The market’s failure overnight below Mon’s 2565 corrective low detailed in the 240-min chart below confirms a bearish divergence in momentum that defines yesterday’s 2586 high as the END of the uptrend, but only the uptrend from 25-Oct’s 2541 low. This is a momentum failure of the smallest degree and of a grossly insufficient scale to conclude anything more than a minor, interim corrective hiccup within the secular bull to eventual new all-time highs above 2586. Nonetheless, while that 2586 high remains intact, it serves as a micro risk parameter from which non-bullish decisions like long-covers and cautious bearish punts can be objectively based and managed by scalpers.
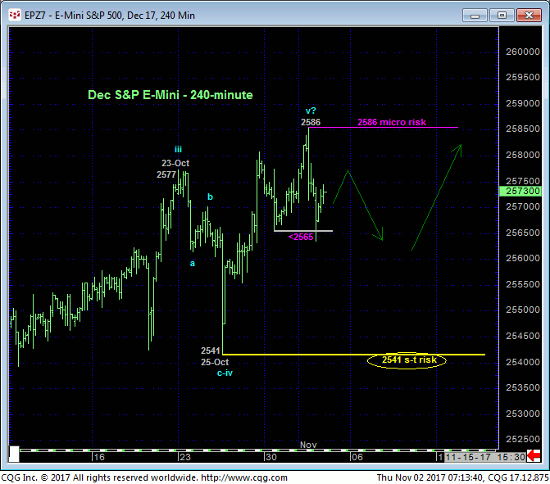
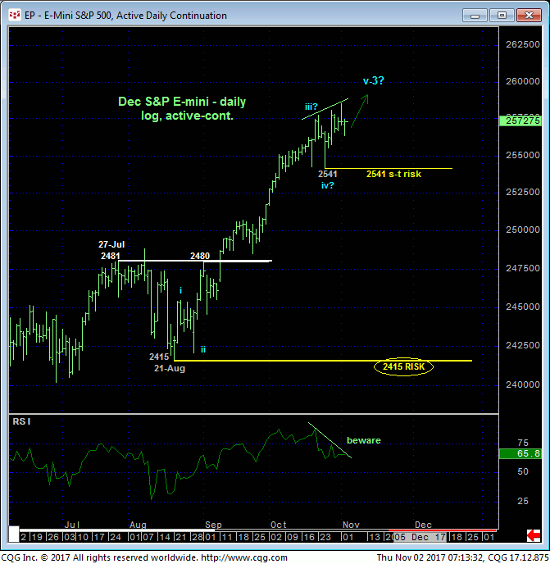
On a broader daily scale above, let alone a weekly scale below, this very short-term mo failure doesn’t even register. Indeed, a failure below 25-Oct’s 2541 low remains minimally required to confirm a bearish divergence in daily momentum and break the uptrend from 21-Aug’s 2415 low, exposing a correction of the portion of the secular bull from that 2415 low. To truly threaten the secular bull trend, commensurately larger-degree weakness below that 2415 low and our long-term risk parameter remains required.
These issues considered, a full and aggressive bullish policy remains advised with weakness below at least 2541 required to defer or threaten this call to warrant neutralizing or paring bullish exposure depending on one’s personal risk profile. Given the 1) major uptrend and 2) short-term toggle points at 2586 and 2541 discussed above however, we’ve identified some favorable risk/reward option strategies with which traders can safely engage tomorrow’s key nonfarm payroll report.
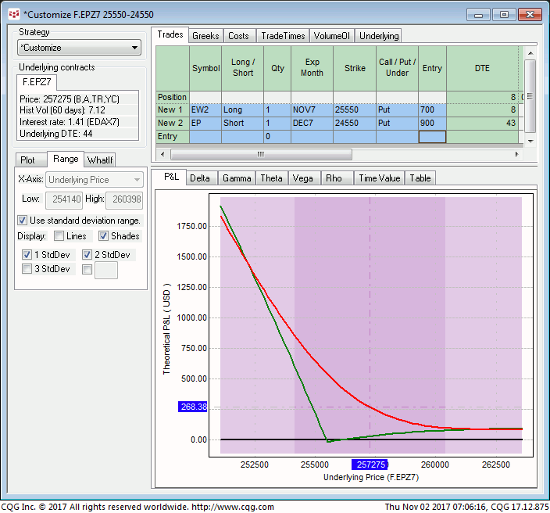
BEAR SPEC: NOV WEEK-2 2555 / DEC 2455 PUT DIAGONAL
This strategy involves buying 1-unit of the Nov Week-2 2555 Puts around 7.00-pts and selling the Dec 2455 Puts around 9.00-pts for a net CREDIT of 2.00-pts ($100 per 1-lot punt) and provides:
- a net delta of -0.21
- enviable gamma ratio of 7:1
- negligible risk if the underlying major uptrend continues
- Significant profit potential (up to 100-pts ($5,000) on a collapse to 2450) on a sustained break below 2555.
As always, the biggest risk to long-gamma diagonal spreads is mere lateral, boring trading. The gamma advantage of diagonal spreads stems directly from the fact that the long put side of the position expires much sooner than the short put side. In this case the Nov week-2 option expires in eight days on 10-Nov, so there’s much less time premium in this option. This gamma advantage comes in exchange for theta (time decay) risk as the premium of the long put will erode much more quickly than the short put that doesn’t expire for 43 days on 15-Dec.
Furthermore, if the underlying contract flat-lines in the week ahead, the long Nov week-2 put will expire worthless and leave a naked short position in the Dec put that exposes unlimited risk if not dealt with properly beforehand. Diagonal spreads are best utilized around a key event where we EXPECT MOVEMENT, either way. If the market doesn’t provide this movement within a reasonable time as a result of the event (like by mid-next-week in the current case), then the entire trade should be covered at a small loss before the long option expires.
BULL SPEC: NOV WEEK-2 2590 / DEC 2640 CALL DIAGONAL
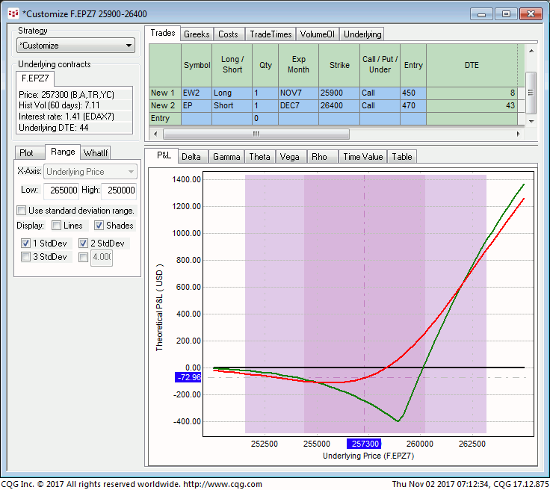
This strategy involves buying 1-unit of the Nov Week-2 2590 Calls around 4.50-pts and selling the Dec 2640 Calls around 4.70-pts for a net cost of 0.50-pts ($25 per 1-lot punt) and provides:
- a net delta of +0.12
- enviable gamma ratio of 6:1
- negligible risk if yesterday’s bearish divergence in short-term mo results in further, even steep losses
- Significant profit potential (up to 50-pts ($2,500) on rally above 2640) on a sustained resumption of the secular bull above 2590.
Here too, if the market doesn’t move sharply either way by mid-next-week as a result of a surprising non-farm payroll report, this strategy should be covered for what should be a small loss in order to avoid the potentially very risky result of the long call expiring worthless and leaving a naked short call position in the face of a secular bull market.
DIRECTIONALLY-AGNOSTIC: NOV WEEK-2 / DEC PUT + CALL DIAGONAL COMBO
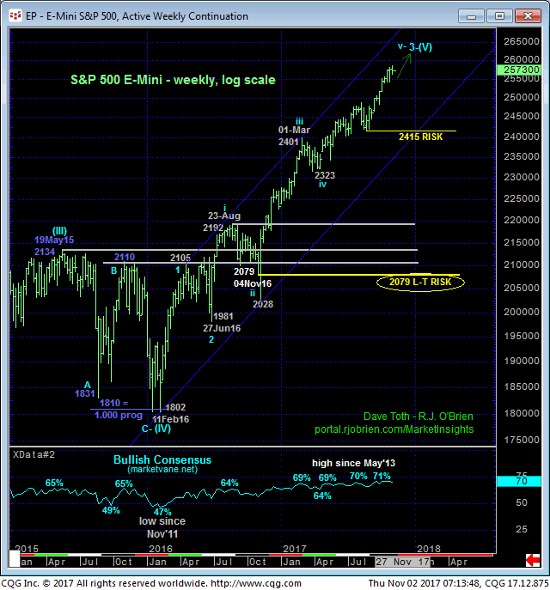
If you’re wondering the P&L graph of both the put and call diagonals COMBINED would look like, the chart below shows it. In effect, this is a long front-month (Nov Week-2) 2590 – 2555 strangle being financed by selling a deferred-month (Dec) 2640 – 2455 strangle. Market direction is pretty much taken out of the equation in exchange for theta risk. But the longer-term risk of this strategy is the same as discussed above: if the market doesn’t MOVE as a result of tomorrow’s nonfarm payroll report by mid-next-week, this trade should be covered for a small loss to avoid the unlimited risk of be naked short an option.
Please contact your RJO representative for updated bid/offer quotes on the strategies above and good luck on tomorrow’s payroll report.
