DEC CRUDE OIL
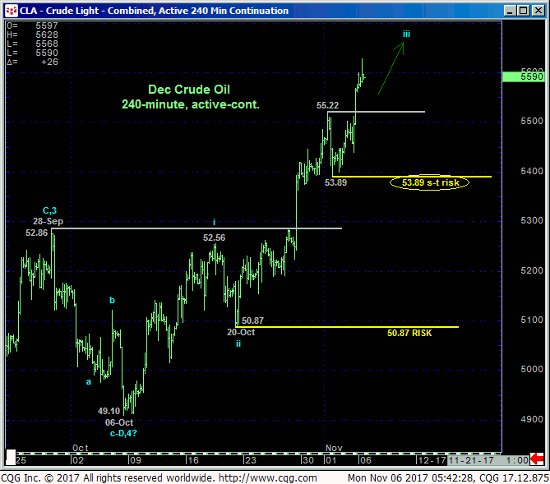
Fri’s break above both last Wed’s 55.22 high and 03Jan17’s 565.25 high reaffirms our new secular bullish count introduced in 18Feb16’s Technical Blog that concluded 11Feb16’s 26.05 low completed the secular bear market from May’11’s 114.83 high and began a multi-quarter base/reversal count calling for a major correction or reversal higher. This continued strength leaves 01-Nov’s 53.89 low in its wake as the latest smaller-degree corrective low the market is now minimally required to fail below to even defer the bull, let alone threaten it. In this regard 53.89 is considered our new short-term risk parameter from which shorter-term traders can rebase and manage the risk of a still-advised bullish policy.
On a daily basis below, 20-Oct’s 50.87 low serves as our next larger-degree corrective low and key risk parameter the market is required to break to defer or threaten our long-term bullish count calling for prospective gains to the 65-to-90-range in the quarters ahead.
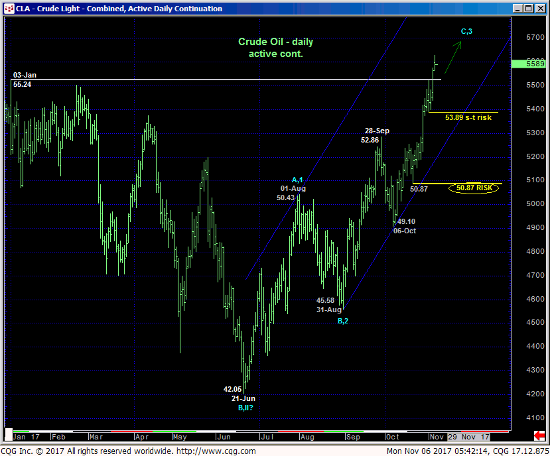
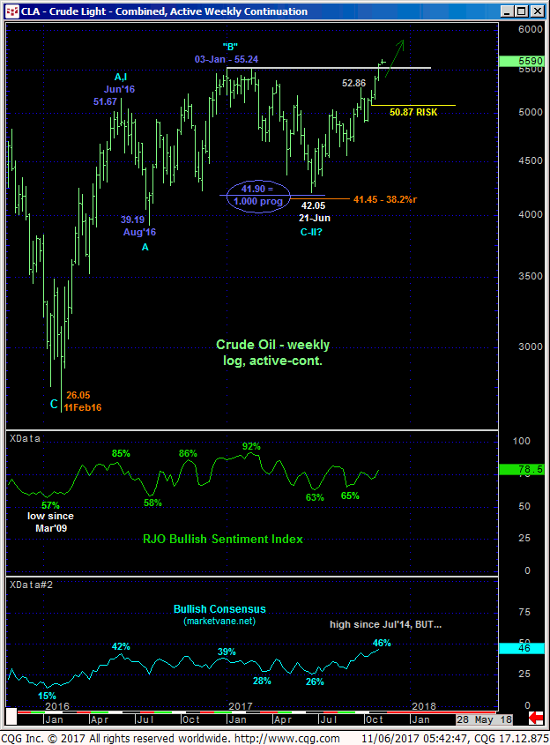
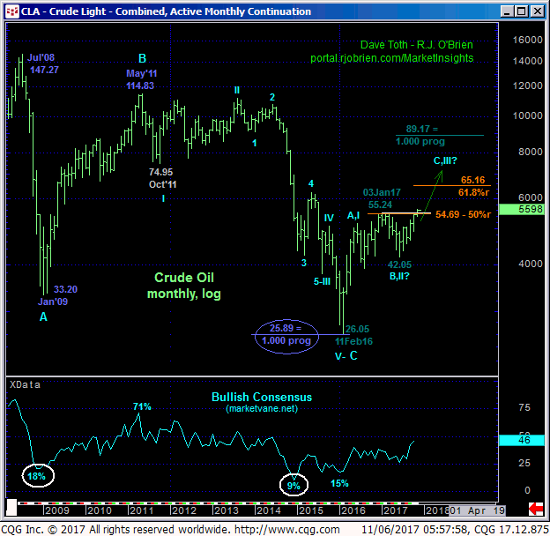
The weekly (above) and monthly (below) log scale charts show the market’s breakout to new highs for the 21-month uptrend from Feb’16’s 26.05 low and highest levels since Jul’15. This breakout exposes an area totally devoid of any technical levels of merit above the market. In effect, there is no resistance. Virtually all technical levels of any merit now exist only below the market in the form of former resistance-turned-support like the 55.25-area and the 52.50-area and prior corrective lows like 53.89 and 50.87. The only levels that exist above the market are derived from previous price action like Bollinger Bands, channel lines, the ever-useless moving averages and even the vaunted Fibonacci progression levels we site often in our analysis. Such merely derived levels never have proven to be reliable reasons to identify resistance or support within a major trend without an accompanying confirmed bearish (in this case) divergence in momentum, and they never will. And such a mo failure requires proof of weakness below a prior corrective low like 53.89.
As for the market’s upside potential, we can only estimate it as indeterminable. The trend is up on all scales and should not surprise by its continuance or acceleration. In the “for-what-it’s-worth department”, we cite a pair of Fib retracement and progression relationships at 65.16 and 89.17 in the monthly log chart below. These are to be taken with a grain of salt, but since the (54.69-area) 50% retrace of 2011-16’s entire 114.83 – 26.05 collapse resulted in 10 months of resistance, perhaps this lends a little bit of credence to either of these other two relationships heading forward. In the end however only a mo failure below a prior corrective low will threaten this bull. And until or unless such weakness is proven, the 21-month uptrend is expected to get keep on keepin’ on.
In sum, a bullish policy and exposure remain advised with a failure below at least 53.89 required to pare or neutralize this position. In lieu of such weakness further and possibly steep, multi-quarter gains remain expected.
DEC HEATING OIL
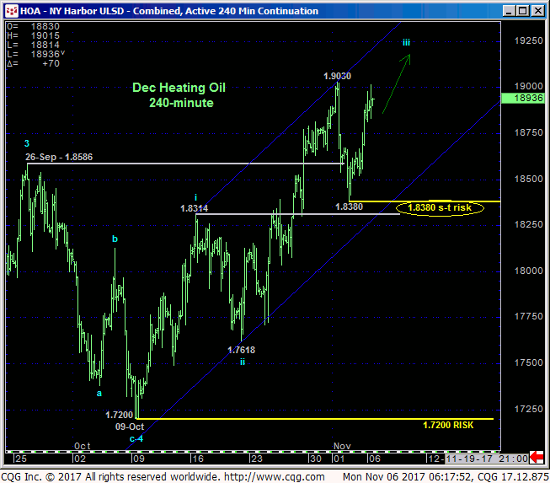
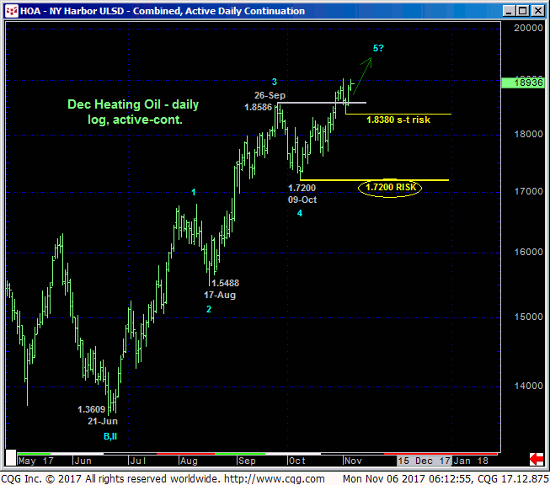
While the Dec diesel market has yet to take out last week’s 1.9030 high, the technical construct and expectations are virtually identical to those detailed above in crude oil with Thur’s 1.8380 considered our new short-term risk parameter this market is now minimally required to break to threaten the bull. Per such a bullish policy remains advised here as well with a failure below 1.8380 required to pare or neutralize bullish exposure commensurate with one’s personal risk profile.
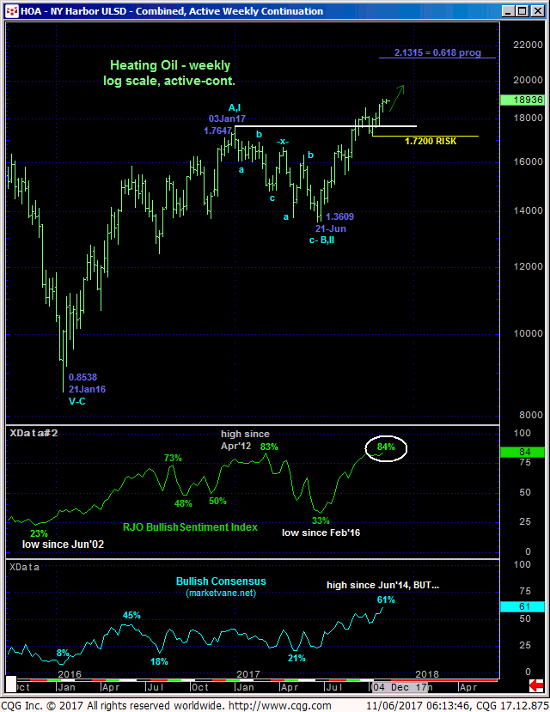
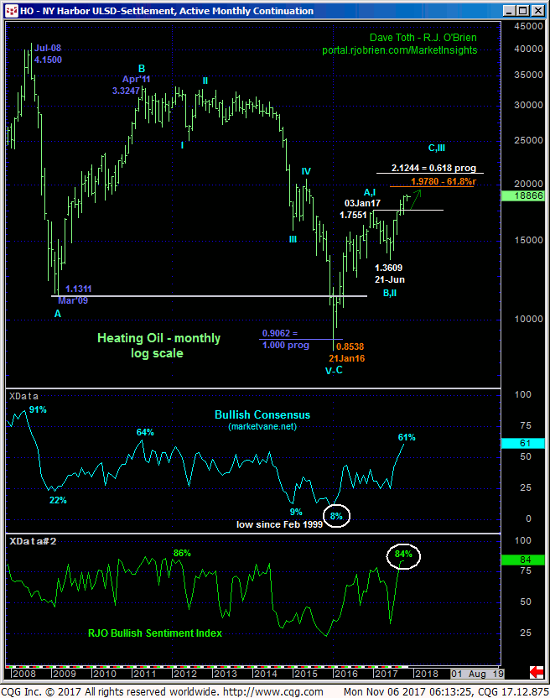
From a long-term perspective 09-Oct’s 1.7200 larger-degree corrective low serves as our long-term risk parameter this market is required to break to break even this year’s portion of the bull from 21-Jun’s 1.3609 low, let alone the 21-Month secular advance. In lieu of weakness below at least 1.8380, further and possibly accelerated gains remain expected as the market has exposed a space totally devoid of any technical levels of merit/resistance. Market sentiment levels have reached understandably high levels that could easily translate into peak/reversal-threat factors. But traders are reminded that sentiment is not an applicable technical factor in the absence of a confirmed bearish divergence in momentum needed to, in fact, break the clear and present uptrend. Herein lies the importance of the short- and longer-term risk parameters discussed above.
