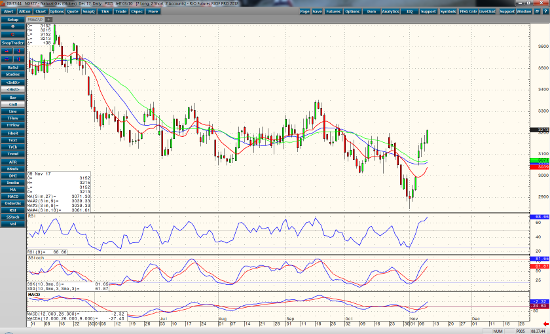
The trend in December Natural gas is up with a higher close 5 trading days in a row. Resistance was fairly strong at 3.200, but as of this writing we have penetrated that level. A close above previous resistance may signal a shift to a higher trading range, with 3.200 becoming the new support and the next resistance number being 3.270-3.300. Caution is warranted because momentum indicators are ranging above overbought levels, but this only means the market is trading with strength in this direction. We will wait to base any bearish plays on divergence between the market pricing and the momentum indicators, MACD and RSI.
Old man winter has come back with below average temperatures forecast in the 11-16 day range for most of the continental United States. The forecast calls for mostly dry weather as well. The natural gas storage number average estimate calls for a 17bcf build, this is well below the 5 year average of 45bcf. Some estimates on the low end are calling for draw in inventory. If this happens we may see a considerable jump in prices. $3.300 resistance is a very real profit target at that point. I’m still suggesting long side exposure until the market tells me differently.
Dec ’17 Natural Gas Daily Chart


