JAN SOYBEANS
The market’s clear failure yesterday below our short-term risk parameter at 9.86 and rejection of the upper recesses of the past month’s range defines yesterday’s 10.08 high as the b- or 2nd-Wave correction of Oct’s 10.13 – 9.81 decline. Yesterday’s relapse confirms the resumption of what we believe will be a correction of Aug-Oct’s rally that may still be contained by 27-Oct’s 9.81 low or could easily break it ahead of further losses to 9.60 or below. Regardless of what lateral-to-lower prices the market has in store, yesterday’s 10.08 high identified THE high and new key risk parameter it now needs to sustain losses below to maintain a more immediate bearish count. Its failure to do so will confirm the sell-off attempt from 13-Oct’s 101.3 high as a correction within our long-term base/reversal count ahead of what then could be surprising gains.
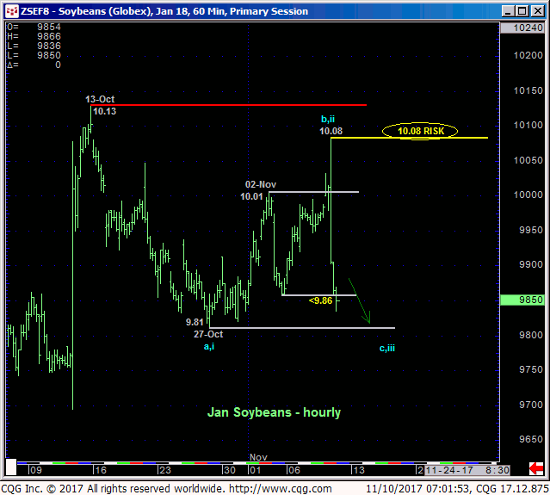
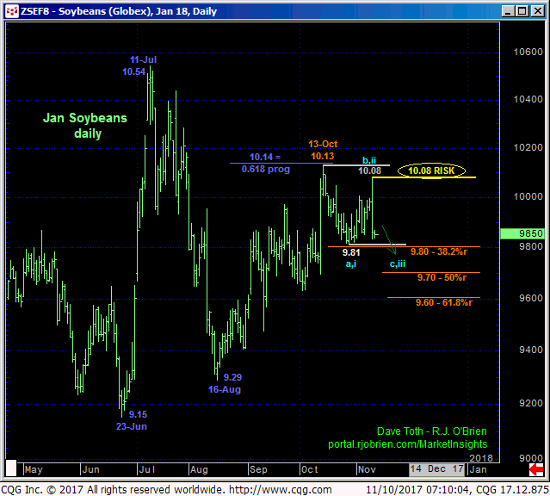
In yesterday morning’s pre-report Technical Blog we highlighted the market’s position currently deep within the middle-half bowels of the past THREE YEARS’ range where the odds of aimless whipsaw risk should be approached as higher than usual. Yesterday’s price action provides further evidence of this affliction. If there’s a bright side however, it’s yesterday’s 10.08 high and new key risk parameter resulting from the post-report relapse. While that high remains intact as a resistant cap, further lateral-to-lower prices are anticipated with a break below 27-Oct’s 9.81 low and 38.2% retrace of Aug-Oct’s 9.29 – 10.13 rally reinforcing this call and exposing further correction of Aug-Oct’s rally.
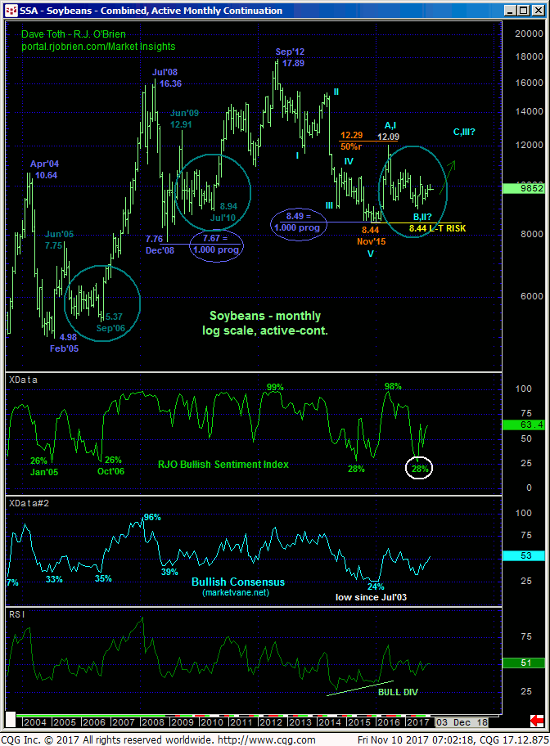
As for the market’s down side potential below 9.81, we believe it must first be approached as indeterminable. There is no way to conclude either a break to “just” the (9.60) 61.8% retrace of Aug-Oct’s 9.29 – 10.13 rally OR a collapse/resumption of the secular bear trend to new lows below Nov’15’s 8.44 low. This said however, we also believe that the market’s 3-YEAR rejection sub-9.00 levels and the lower-quarter (i.e. below 9.25) of this 3-year lateral range gives higher odds to “just” a correction of the Aug-Oct rally within a major BASE/reversal count that will ultimately produce 12.00 or higher levels before sub-9.00 levels. Against this long-term base/reversal-threat backdrop such a sell-off to 9.60 OB would present an outstanding risk/reward buying opportunity for long-term players.
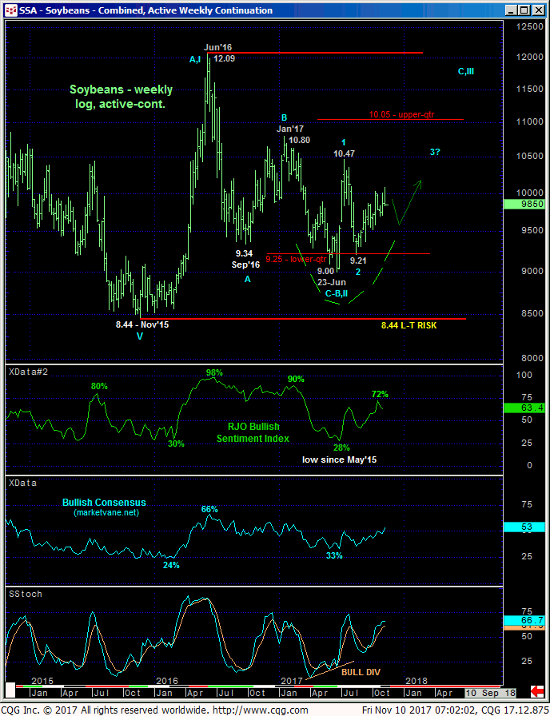
This long-term base/reversal count remains predicated on:
- early-2016’s bullish divergence in MONTHLY momentum that, in fact, breaks the 3-year downtrend and defines Nov’;15’s 8.44 low as the
- END of a 5-wave Elliott sequence down from Sep’12’s 17.89 all-time high amidst
- historically bearish sentiment not seen since 2003 and where
- the 2012-2015 secular bear market EQUALLED EXACTLY (i.e. 1.000 progression) BOTH the 2008 AND 2004-05 bear markets in length.
This Fibonacci fact (that was also mirrored in the corn market!!!) remains a compelling mind-boggler and contributor to a list of base/reversal factors that will remain intact until and unless the market breaks Nov’15’s 8.44 low. Against this backdrop any interim dip or continuation of the past month’s non-uptrending behavior could be a 2017 Christmas gift for long-term bulls heading into the 2018 crop year.
These issues considered, an interim cautious bearish policy and exposure remain advised ahead of further lateral-to-lower prices (especially on a break below 9.81) with strength above 10.08 required to negate this call and reinforce a base/reversal count that could surprise to the upside.
DEC SOYBEAN MEAL
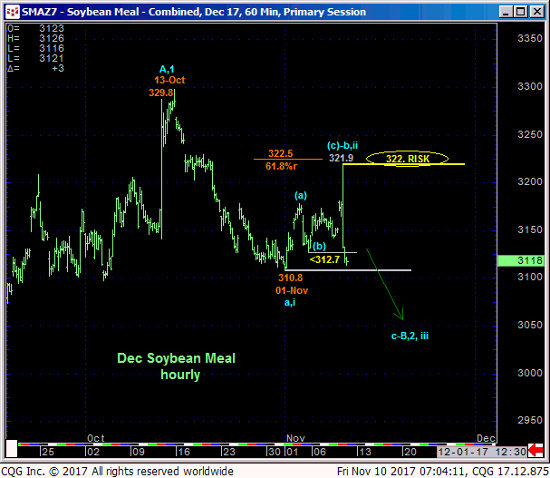
Similarly, yesterday’s relapse below 03-Nov’s 312.7 low rendered the past week’s recovery attempt top yesterday’s 321.9 high a 3-wave affair that is considered the b- or 2nd-Wave correction of late-Oct’s 329.8 – 310.8 decline ahead of a (c- or 3rd-Wave) resumption of that downtrend that preceded it to new lows below 310.8. As a direct result of this relapse we are considering 322.0 as our new key risk parameter from which an interim bearish policy and exposure can be objectively rebased and managed.
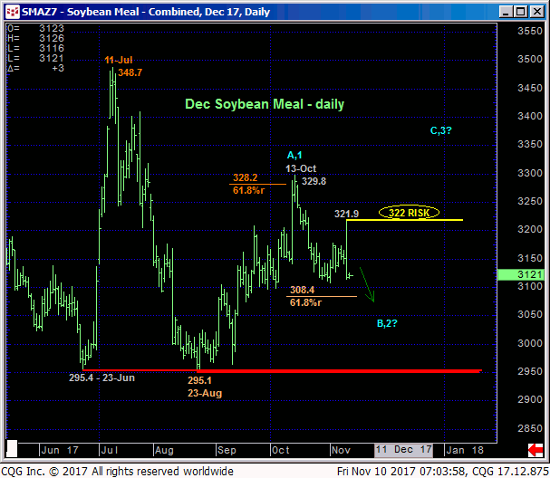
As the dominance of the 295-area support is clear in the daily chart of the Dec contract above and its weekly close-only chart below, traders are advised to first approach further losses as just a correction of Aug-Oct’s 295.1 – 329.8 rally and an eventual favorable risk/reward buying opportunity. Until stemmed by a confirmed bullish divergence in momentum however or a recovery above 322, the depth of this correction is indeterminable. We noted the (308.4) 61.8% retrace of Aug-Oct’s rally as a “reference point” around which to beware such a mo failure, but this merely derived level is NOT considered support.
The weekly chart below also show the magnitude of the incessant lateral range between 337 and 297 over the past 17 months where continued aimless whipsaw risk should hardly come as a surprise.
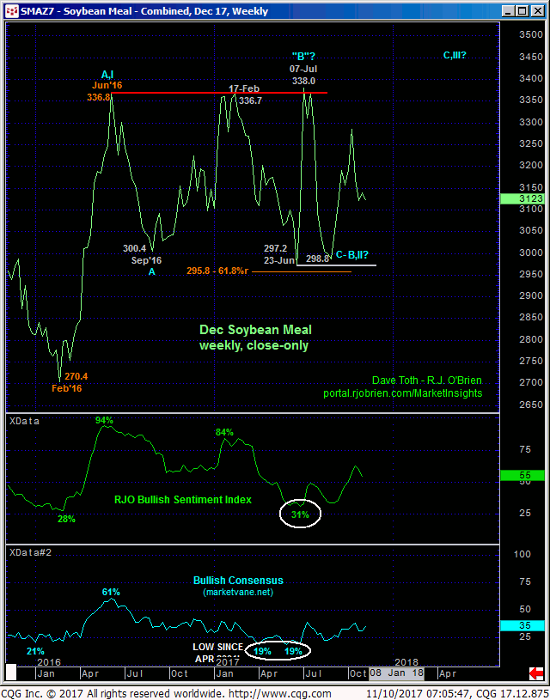
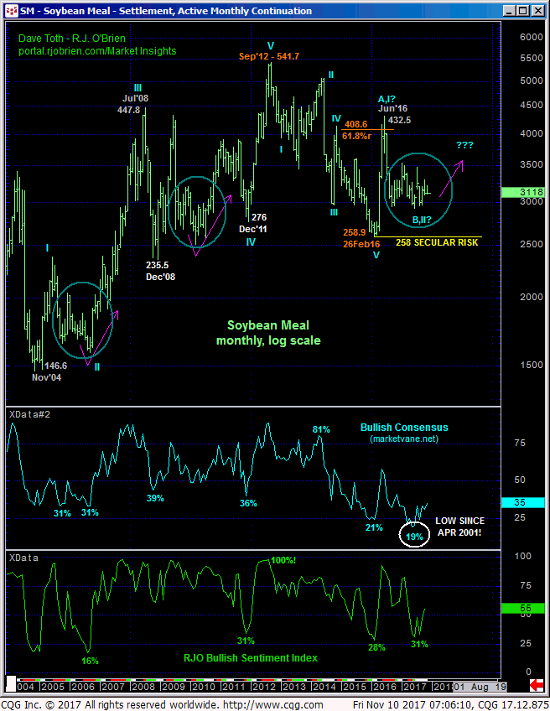
From an even longer-term perspective the weekly (above) and monthly (below) log scale active-continuation charts present the same MAJOR BASE/REVERSAL conditions as those detailed above for bean. To threaten or negate this long-term bullish count all the bear has to do is (first) break the 295 lower-quarter of the 3-YEAR range and then (secondly) SUSTAIN trendy, impulsive price action down and break Feb’16’s 258 low. Simple and clear.
Price action other than this- like the market’s continued 3-YEAR rejection of sub-300 levels and a recovery above 322 and then 330- would reinforce this bulish count and call for a run at 400-to-450 or higher next year.
These issues considered, an interim cautious bearish policy is advised ahead of further lateral-to-lower losses to the 308-area or lower with a recovery above 322 negating this call, warranting its cover and resurrecting a broader bullish count towards Jul’s 348 high.
