After an impressive 23% gain on the year copper could be seeing global growth continue to boost demand. With falling unemployment and rising industrial production, this could lead to the next major drawdown in inventory. Looking at LME Copper stocks we have seen a drawdown of 13 out of the past 17 days. Now, Shanghai copper stocks may have risen in recent weeks, but I feel that will slowly wind down once Chinese demand kicks back into full swing.
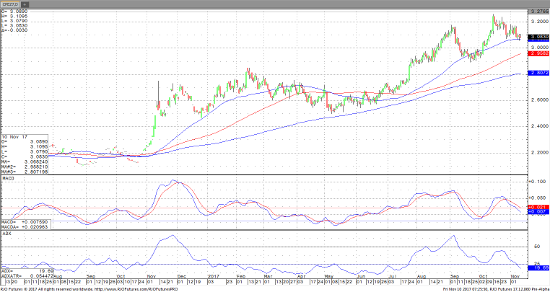
Looking at a daily chart of December copper, it’s easy to see that each pull back was met by a higher high and Fibonacci extensions should command the next wave up to 3.35/LB. Keep an eye out for two consecutive closes below the 50 DMA at 3.0683 where a washout may occur down to 2.9582.
Dec ’17 Copper Daily Chart


