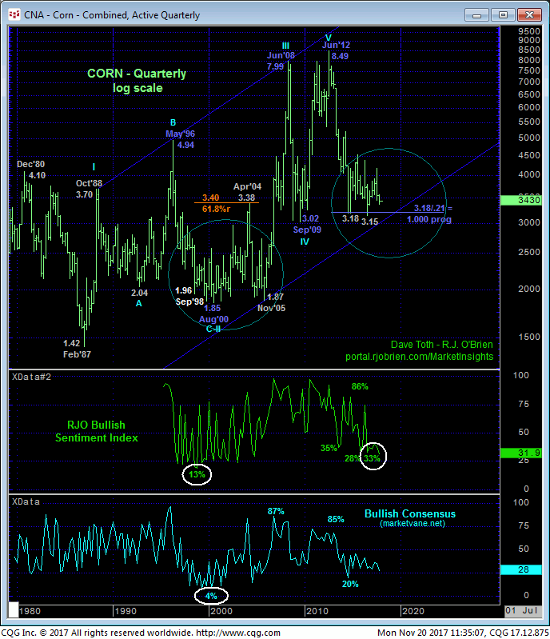
Last week’s continuation of the 4-month downtrend refreshes a bearish count with some tighter but objective risk parameters around which to rebase and manage the risk of a still-advised bearish policy with Fri and today’s recovery attempt first approached as a (prospective 4th-Wave) correction ahead of at least one more round of new lows below Thur’s 3.36 low. Of the count down from 25-Oct’s 3.55-1/4 high, the decline from 02-Nov’s 3.52 high spanned exactly 1.618-times the length of late-Oct’s 1st-Wave break from 3.55 to 3.45, Combined with a ton of former support-turned-resistance between 3.42 and 3.45, minimally, the market needs to recoup levels above 31-Oct’s 3.45 1st-Wave low on this smaller scale to jeopardize the impulsive integrity of a bearish count that’s got more to go. Per such 3.45 is considered our new short-term risk parameter to a still-advised bearish count.
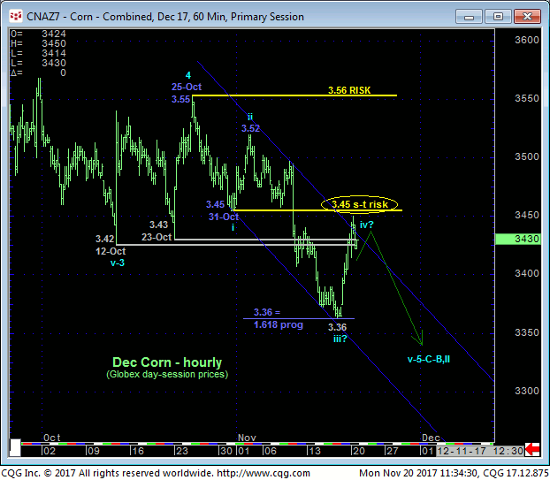
Only a glance at the daily log scale chart above is needed to see the ton of now-former support from the 3.42-to-3.45-area that, since broken, would be expected to hold as new resistance IF the market is still truly bearish “down here”. This chart also contains our preferred count that calls 25-Oct’s 3.55-1/4 high the 4th-Wave correction high of what’s shaping up to be a textbook 5-wave Elliott count down from 11-Jul’s 4.17 high. IF this market has something broader to the bear side in store, then it is imperative that it now sustain losses below 3.56. Its failure to do so will not only confirm a bullish divergence in momentum and a complete 5-wave count down, it will usher back into the equation a host of other technical facts consistent with a BASE/REVERSAL count that could be major in scope. Per such we are considering 3.56 as our new key risk parameter around which to toggle directional biases and exposure. 3.56 will be a precise and favorable risk/reward condition above which producers can effectively remove hedges while end-users will be urged to implement them.
We’ve tossed in a couple admittedly derived Fibonacci progression relationships down from 25-Oct’s 3.55 4th-Wave high. Often times when a 3rd-wave “extends” as the decline from 20-Jul’s 4.07 high to 12-Oct’s 3.42 low did, the 5th-wave of the sequence will bear some Fibonacci relationship to the 1st-wave of the sequence, in this case mid-Jul’s break from 4.17 to 3.82. Thus far the resumed decline from 3.55 has spanned a length exactly 61.8% of Jul’s initial 4.17 – 3.82 decline. To reach a similar length (i.e. 1.000 progression) to mid-Jul’s break the bear would project to the 3.25-area. While interesting, the absolute technical key remains, quite simply, the bear trend’s ability to sustain itself, first below 3.45 and then certainly below 3.56.
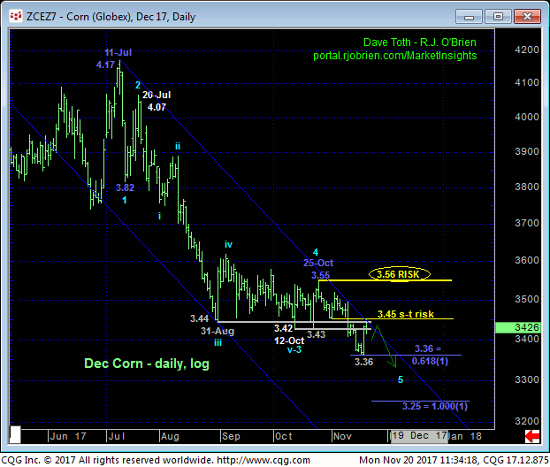
Other technical facts integral to a major base/reversal-threat count are:
- the market’s return to the lower-quarter of the past THREE YEAR range amidst
- waning downside momentum on a weekly scale amidst
- historically bearish sentiment that has warned of and accompanied virtually every major base/correction/reversal this market has experienced over the past 30 years.
As always, traders are warned that sentiment is not an applicable technical tool in the absence of a confirmed bullish divergence in momentum, hence the importance of the market proving “non-weakness” via a recovery above 3.56. But at a current 32% reading reflecting 204K Managed Money long positions to a whopping 434K shorts, fuel for upside vulnerability is in ample supply if this market cannot sustain the downtrend below 3.56. If this market cannot sustain losses below 3.56, we believe this combination of a confirmed bullish divergence in momentum, complete wave count and historic bearish sentiment will set the foundation for months and perhaps even quarters of rallying prices and present THE risk/reward opportunity of the year.
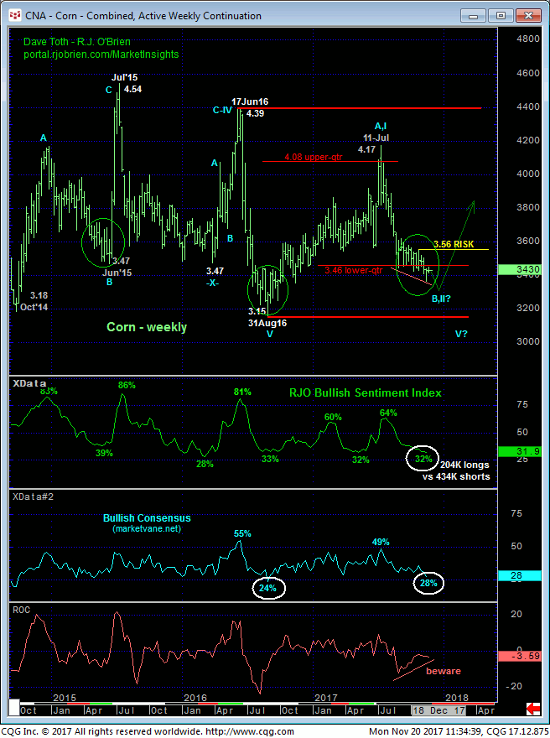
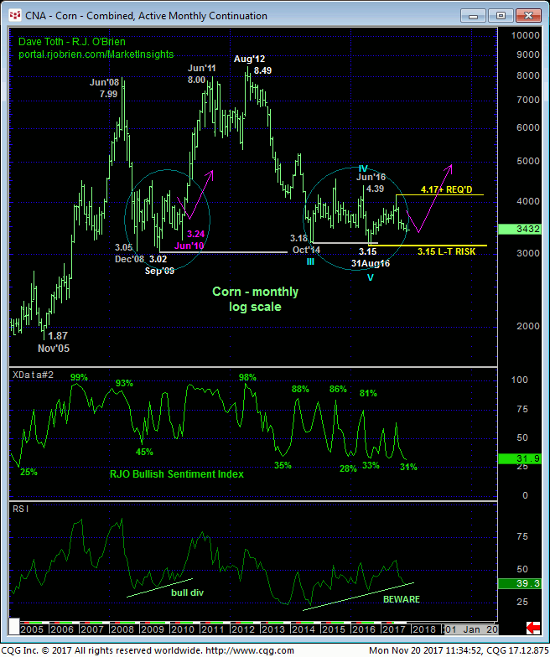
From an even longer-term perspective, we have referred to the monthly (above) and quarterly (below) log scale chart many times of late as they show the past major base/reversal processes similar to what we believe has been unfolding since Oct’14’s 3.18 low. The clincher however remains the fact that the secular bear market from Jun’12’s 8.49 high has thus far spanned a length IDENTICAL (i.e. 1.000 progression) to BOTH the 2008-09 AND 1996 – 2000 BEAR MARKETS. COMBINED with all of the base/reversal elements listed above, we believe this market is only a recovery above 3.56 away from exposing another such reversal and tremendous risk/reward buying opportunity.
If you’re bearish this market as you should be currently for both technical and certainly fundamental reasons, you’ve got tons of company. And this is of absolutely no matter as long as the downtrend sustains itself. If it cannot- and we’re designating the 3.56 level as THE gauge of such a failure- then the market will have rejected/defined a specific and reliable level from which all non-bearish decisions can be objectively based and managed ahead of a base/reversal threat that we believe could be major in scope. Near-term strength above 3.45 will provide an early warning of such. In lieu of at least 3.45+ strength and preferably 3.56+ strength, a bearish policy and exposure remain advised. But we believe that, technically, this market is at a major and extraordinarily opportunistic crossroads with unique and compelling risk/reward merits if it cannot stay below 3.56.
