JAN SOYBEANS
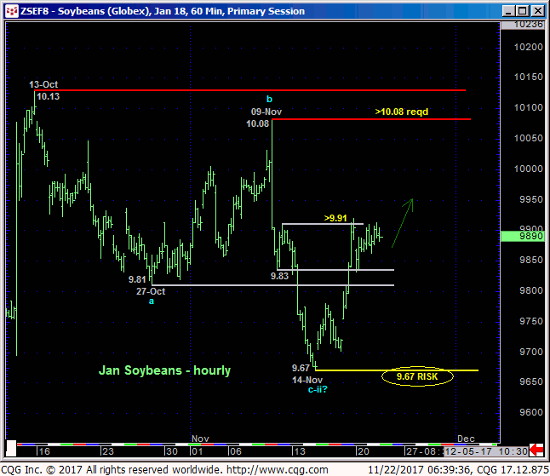
The market’s gross failure to sustain last week’s losses below 27-Oct’s 9.81 low when the bear had the opportunity to perform and subsequent recovery above 10-Nov’s 9.91 we identified as a short-term risk parameter has not only clearly stemmed the decline from 09-Nov’s 10.08 high, but also exposes the entire sell-off attempt from 13-Oct’s pivotal 10.13 high as a 3-wave affair as labeled in the hourly chart below. Left unaltered by a relapse below 14-Nov’s 9.67 low, this 3-wave decline is considered a corrective/consolidative event that warns of a resumption of Aug-Oct’s uptrend that preceded it.
Nov and Oct highs at 10.08 and 10.13, respectively, remain intact as obvious resistance that the bull’s now required to break to reinstate the broader uptrend and reinforce our long-term base/reversal count. While that resistance remains intact so too does the prospect for further lateral, consolidative chop within the 10.13-to-9.67-range. But until and unless this market breaks last week’s 9.67 low that we’re now considering our new key risk parameter and for longer-term reasons we’ll discuss below, we believe the directional scales have tipped back in favor of the bull and warrant a return to a cautious bullish policy.
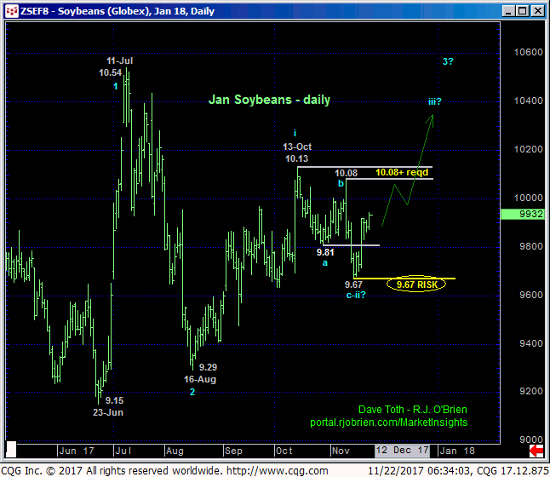
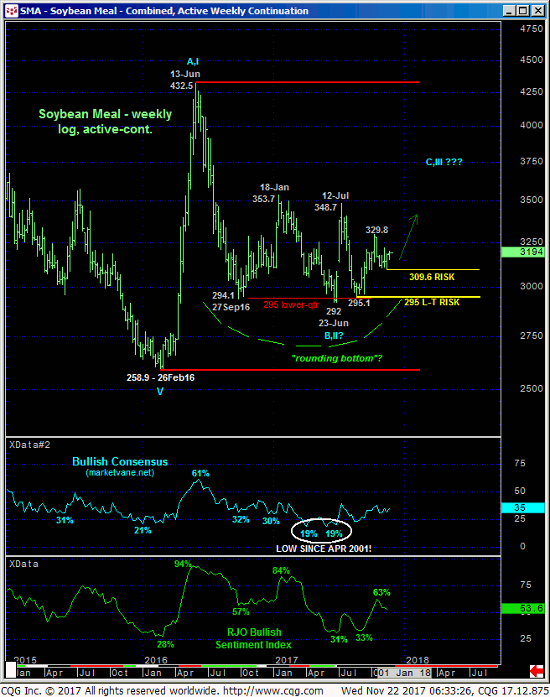
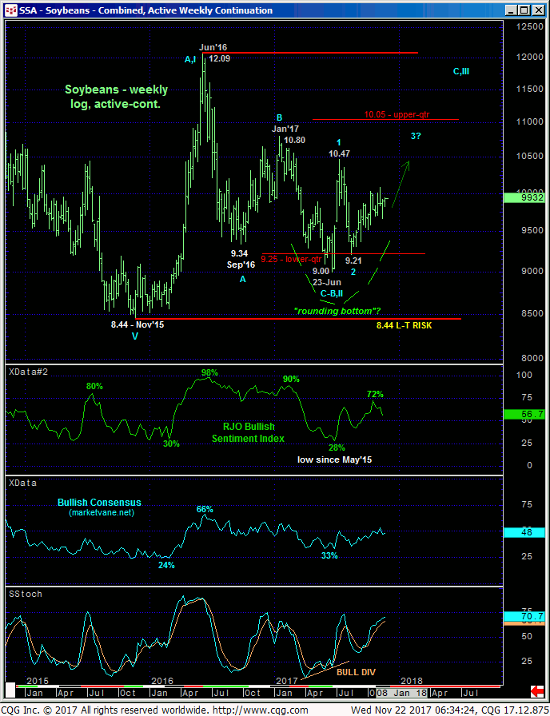
Moving out to a broader scale, the daily (above) and weekly log scale (below) charts show the market’s position in the middle of the past month’s range that’s in the middle of this year’s range that’s in the middle of the past THREE YEAR range. This “ranges-within-ranges” predicament maintains the odds of continued aimless whipsaw risk that everyone has been enduring for months. From an even longer-term perspective however, this market has yet to provide any evidence whatsoever to mitigate our MAJOR BASE/REVERSAL count predicated on:
- the market’s continued rejection of the lower-quarter of the 3-year range
- an arguable “rounding-bottom” reversal structure this year
- late-Jun/early-Jul’s bullish divergence in WEEKLY momentum that cements Jun’s 9.00 low as THE END of
- a complete 5-wave Elliott sequence from Jan’s 10.80 high AND a 3-wave and thus CORRECTIVE structure from Jun’16’s 12.09 high amidst
- historically bearish sentiment.
Until and unless this market starts taking out lows like 9.00, 9.15, 9.29 and even last week’s tight 9.67 low, all of these factors listed above contribute to a BASE/REVERSAL-threat environment that we believe will be major in scope.
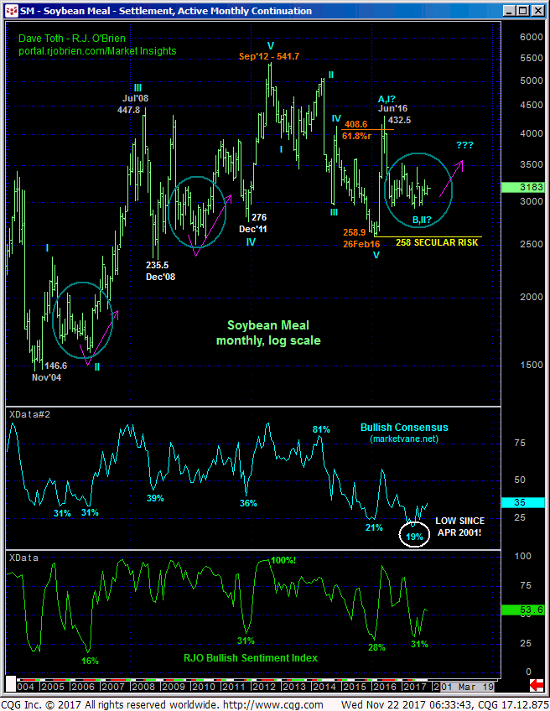
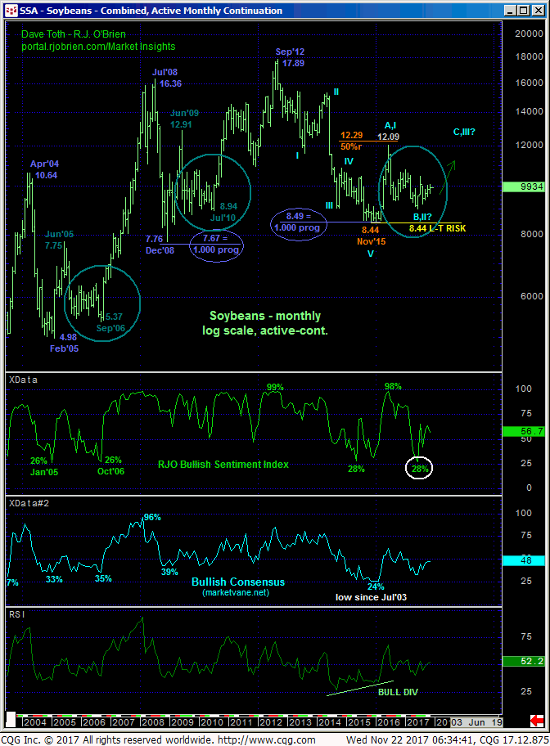
Additionally and as we’ve discussed many times since Nov’15’s 8.44 low, the Fibonacci fact that the secular bear trend from Sep’12’s 17.89 high spanned an IDENTICAL LENGTH (i.e. 1.000 progression) to BOTH 2008 and 2004-05’s bear markets remains as an incredible contributor to our major base/reversal count. And thus far the base/reversal PROCESS from Nov’15’s 8.44 low that includes an initial A- or 1st-Wave rally and a countering B- or 2nd-wave correction that we always discuss and likely “extensive” in terms of both price and time is virtually identical to those processes that followed both of the Dec’08 and Feb’05 lows.
These issues considered, we believe our major base/reversal count remains well intact with the past four days’ recovery identifying 14-Nov’s 9.67 low as another likely END to a corrective setback from which a bullish policy and exposure can be objectively rebased and managed. A failure below 9.67 is now required to defer or threaten a bullish count. In lieu of such sub-9.67 losses we anticipate an eventual resumption of Aug-Oct’s uptrend to new highs and potentially significant above 10.13. While the past month’s 10.08-to-10.13-resistant cap remains intact however, further lateral, intra-range chop should not surprise. The middle-half of the 10.13 – 9.67-range presents a poor risk/reward condition from which to initiate bullish exposure, so more cautious, conservative bullish exposure (perhaps via options) that can be weathered to a 9.67 risk point is advised.
DEC SOYBEAN MEAL
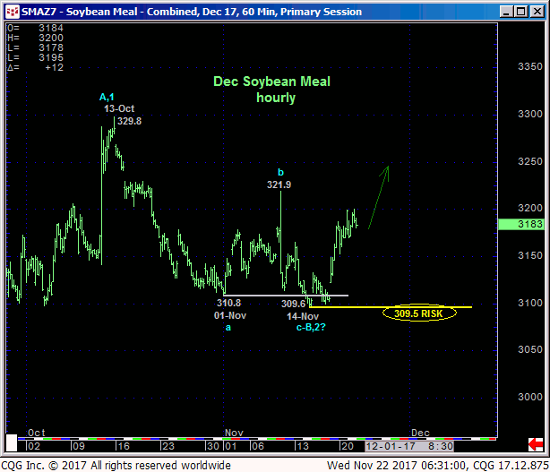
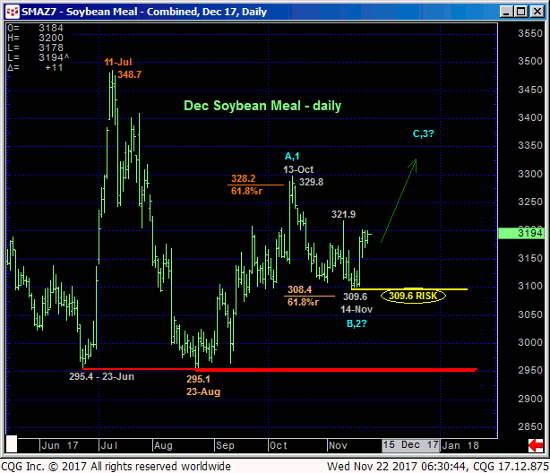
From a short-term perspective all the way out to a very long-term one the technical construct and expectations for meal are identical to those detailed above in beans with last week’s 309.5 low considered our new short-term but key risk parameter from which a resumed cautious bullish policy is advised to be rebased and managed.
