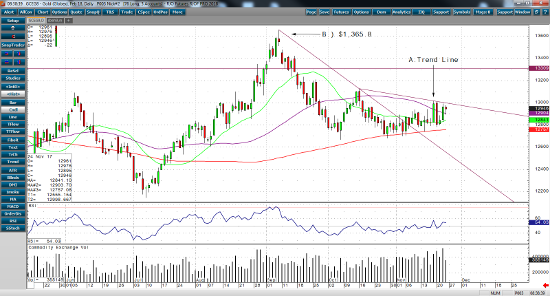
In the early Friday trade, February gold is slightly down $4 and currently trading at $1,288.0. After the dollar had a huge sell off on Tuesday and equities backed off their all-time high, the stars were aligned for gold to have a big day and closed at its second highest level in over a month at $1,294.6. As the stock market has regained its upward momentum, gold has lost a little of its steam. The US dollar has continued its sell off overnight, so after a big day on Wednesday for gold, watch for it to continue its rally today. However, Fed Chair Janet Yellen’s statement of concern about a lack of inflation has traders a little less optimistic of further rate hikes into 2018.
If we take a look at the daily February gold chart, you’ll clearly see the trend line that gold needs to break above and hold in order to continue its rally. It roughly comes in at $1,299.0, so if it closes above the $1,300.0 an ounce handle and the US dollar continues to sell off along with some bullish news, then gold might be able to rally all the way back up to its high of $1365.8, which it reached back on September 8.
Feb ’18 Gold Daily Chart


