EURUSD
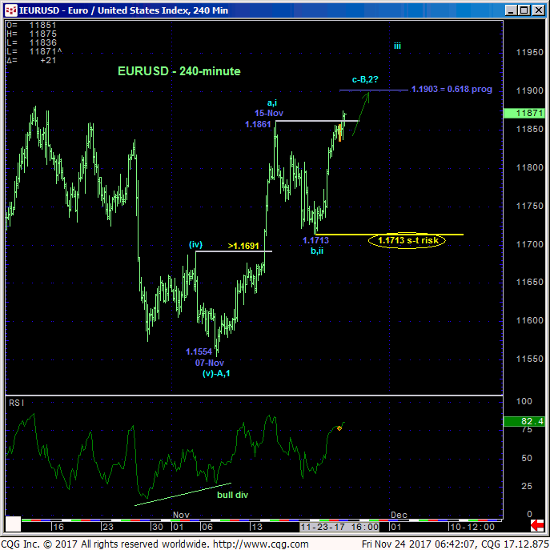
Overnight’s break above 15-Nov’s 1.1861 high reaffirms the intermediate-term uptrend introduced in 14-Nov’s Technical Blog and leaves Tue’s 1.1713 low in its wake as the latest smaller-degree corrective low the market’s now got to sustain gains above to maintain a more immediate bullish count. Its failure to do so will stem Nov’s recovery attempt, render it a 3-wave and thus corrective affair we suspect it to be and resurrect a peak/reversal environment that we believe is relatively major in scope. In this regard 1.1713 becomes our new short-term risk parameter from which non-bearish decisions like short-covers and cautious bullish punts can be objectively rebased and managed.
In the “for-what-it’s-worth department” the 1.1903 will make the current rally from Tue’s 1.1713 low 61.8% of the length of mid-Nov’s preceding 1.1554 – 1.1861 rally, an area around which we’ll be watchful for any bearish divergence in momentum needed to stem this recovery and perpetuate that broader peak/reversal count.
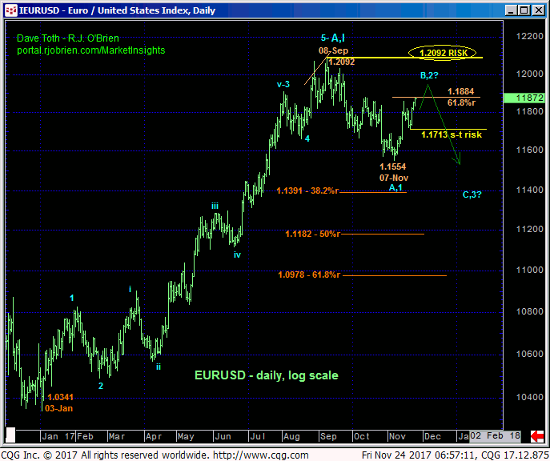
The daily log scale chart below shows the market’s engagement with the (1.1884) 61.8% retrace of Sep-Nov’s 1.2092 – 1.1554 decline, a neighboring Fibonacci relationship to the 1.1903 progression relationship discussed above that contributes to this general area as one “of interest” around which to be watchful for the requisite bearish divergence in momentum needed to arrest the current recovery and maintain the prospect for a broader peak/reversal count we’ve been discussing since mid-Sep.
Relative to the magnitude of this year’s broader uptrend, Sep-Nov’s sell-off attempt is kind of a “tweener”. It’s enough to break this year’s uptrend but also still well within the bounds of a correction within this year’s uptrend that could be poised to resume. After such significant trends we typically prepare for a corrective retest of the high that’s “more extensive” (i.e. 61.8% ret or more) as it takes time for the technical and fundamental factors that drove the broader trend to erode to the point of a bigger reversal. Per such the past couple weeks’ rebound falls well within the bounds of a correction within a broader PEAK/reversal PROCESS.
This said however, “somewhere in here” and shy of 08-Sep’s 1.2092 high and key risk parameter this market has to confirm a bearish divergence in momentum to reinforce a broader peak/reversal count. Herein lies the importance of Tue’s 1.1713 corrective low and short-term risk parameter. Until and unless the market proves such sub-1.1713 weakness AT LEAST the intermediate-term trend is up and there’s no way to know this uptrend won’t accelerate as part of a resumption of this year’s major bull to new highs above 1.2092. In effect the market has identified 1.2092 and 1.1713 as the key directional triggers heading forward.
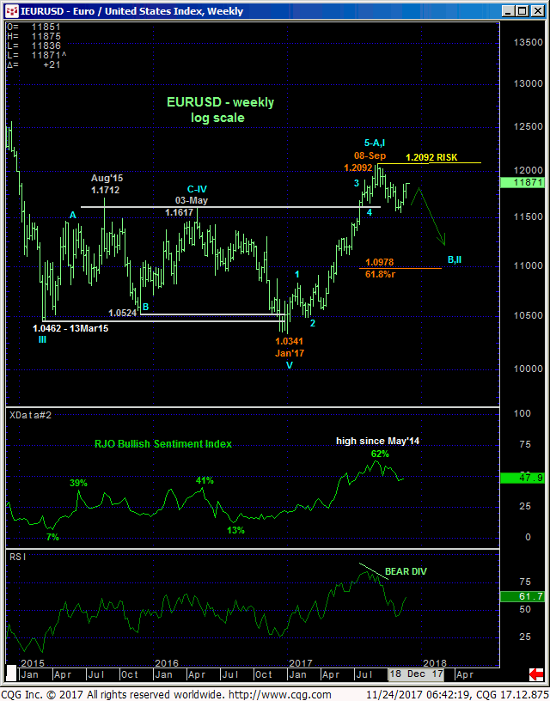
Longer-term traders are reminded of the factors on which a major peak/reversal count is predicated:
- the huge (i.e. YEARS) former support from the 1.19-to-1.21-area that, since broken in Jan’15, now serves as a major new resistance candidate
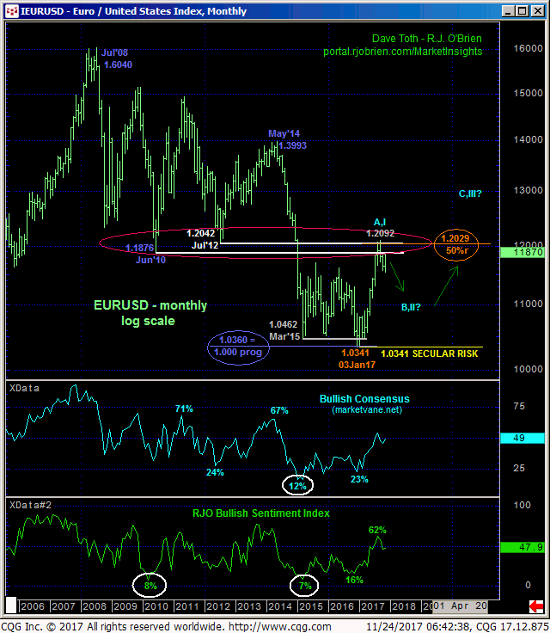
- an arguably complete 5-wave Elliott sequence for this year’s rally labeled in the weekly log chart above amidst
- what was historically bullish sentiment not seen in over three years accompanying
- Sep’s bearish divergence in momentum that STILL marks its 1.2092 high as an unbroken and key resistant cap and the level the market needs to break to negate this peak/reversal threat and reinstate 2017’s bull.
These issues considered, a cautious bullish policy remains OK for shorter-term traders with a failure below 1.1713 required to not only negate this call but also resurrect a peak/reversal count that could be significant in scope and span months. Longer-term players are OK to maintain a cautious bearish position with a recovery above 1.2092 required to negate this call and warrant its cover.
USD INDEX
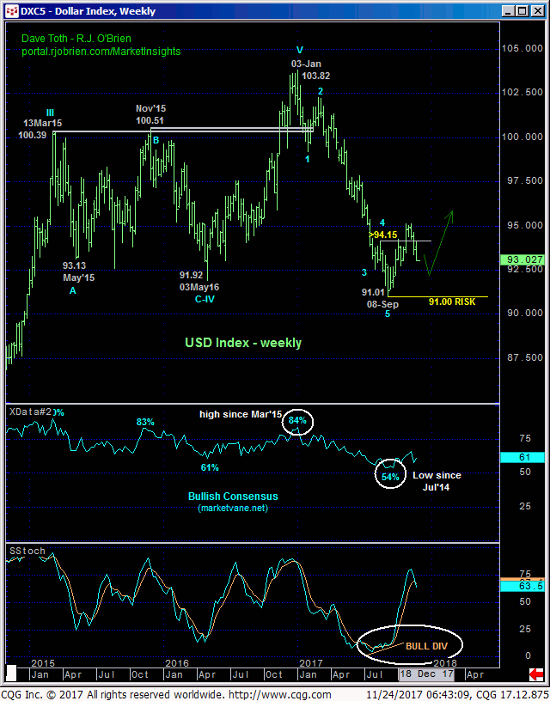
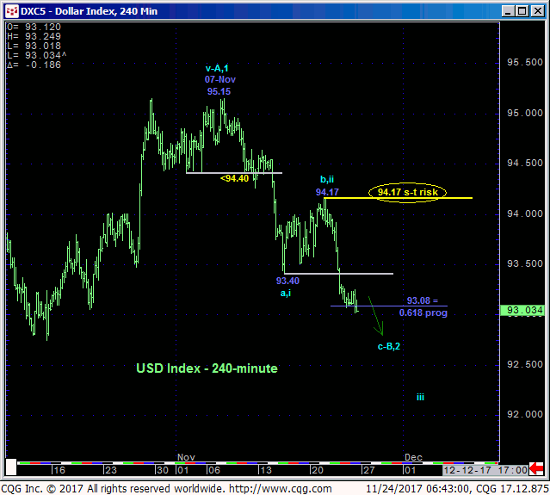
The technical construct and expectations for the USD Index are virtually identical to those detailed above for the Euro, only inverted, with Tue’s 94.17 corrective high serving as our new short-term risk parameter the market needs to recoup to arrest Nov’s slide and resurrect a broader base/reversal count.
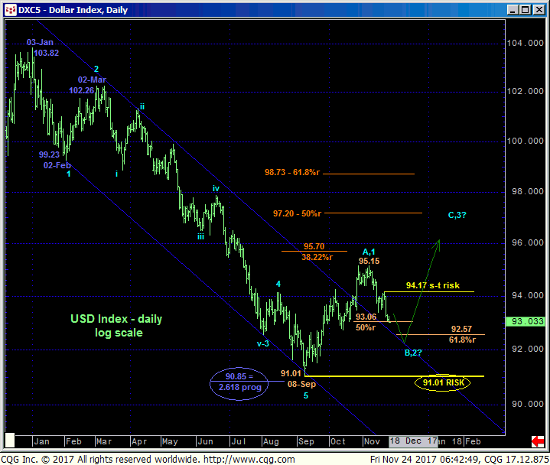
For longer-term players however 08-Sep’s 91.01 low remains intact as a key support and long-term risk parameter from which a bullish policy can continue to be objectively based and managed per a base/reversal count that could span months more. In effect we believe the market has identified 94.17 and 91.00 as the key directional triggers heading forward. Acknowledge and be flexible to the inevitable breakout from this range, either way.
