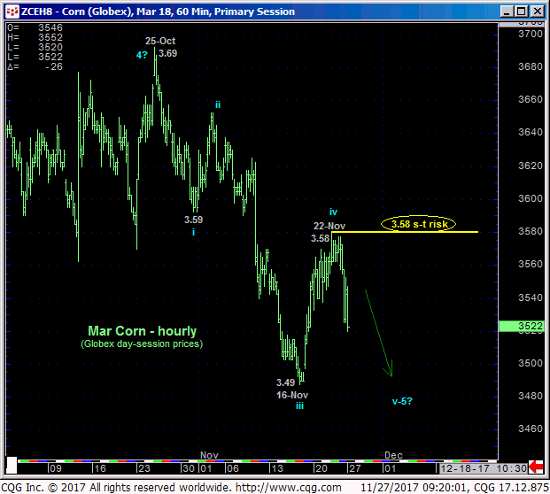
In last Mon’s Technical Blog we discussed the likely prospect that the recovery from 16-Nov’s 3.36 low in the then-prompt Dec contract was just a smaller-degree (4th-Wave) correction within the decline from 25-Oct’sd larger-degree corrective high and 4th-Wave correction within the long-term slide from early-Jul’s high with the end result being a relapse to yet another round of new lows for the entire downtrend. Shifting to the now-prompt Mar contract detailed in the hourly chart below and as a result of Fri and today’s relapse, we believe the market has acknowledged the general 3.57-to-3.59-area of former support as a new near-term resistance specifically at 3.58 on an intra-day basis. Per such we are identifying 3.58 as our new short-term risk parameter from which shorter-term traders with tighter risk profiles can objectively rebase and manage the risk of a still-advised bearish policy. 3.58 is the minimum level that, if recouped, could be the short-term spark to a BASE/reversal count that could be major in scope.


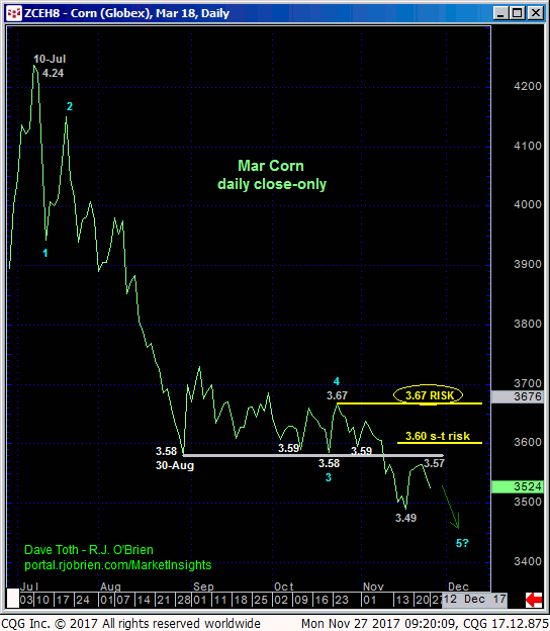
The 3.58/3.59-area of former support-turned-resistance is crystal clear in the daily close-only chart above. A daily close above this area would raise the odds that the textbook-looking 5-wave sequence down from 10-Jul’s 4.24 high is COMPLETE ahead of a correction or reversal higher that, for currently historically bearish sentiment reasons, we believe could be major in scope. To really confirm such a major base/reversal threat however, commensurately larger-degree proof of strength above 25-Oct’s 3.69 larger-degree corrective high and key risk parameter is required.

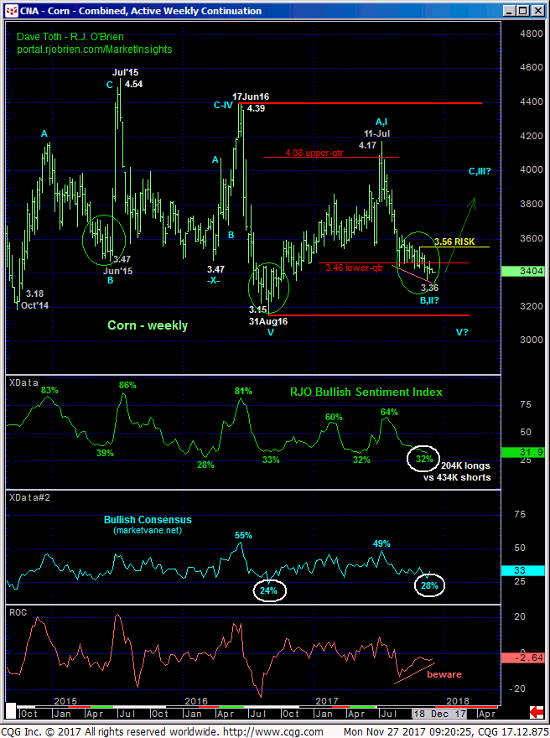
We don’t need to hash over all of the long-term base/reversal technical elements discussed in last Mon’s Technical Blog as nothing has change on this scale since then. But when the weekly log active-continuation chart below starts reflecting Mar18 prices that are 12-cents above current Dec17 prices, it may be yet another nail in the coffin of a base/reversal count predicated on, among a host of other factors, the market’s 3-YEAR inability to make any bearish headway below the lower-quarter of the 3.15 – 4.54-range. If there’s a time and place to be keenly alert to the prospect for the next chapter of a major base/reversal count, we believe it will be from the 3.52-to-3.45-range in the Mar contract and in the period immediately ahead. Of course, proof of strength above at least 3.58 and preferably 3.69 remains needed to raise the stakes in this bull-bear battle.
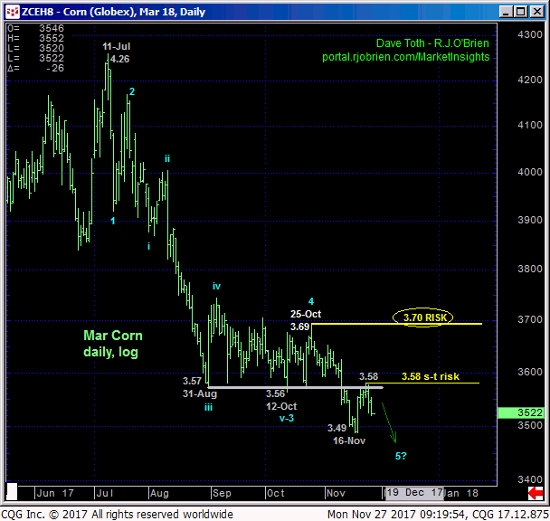
In sum, a bearish policy and exposure remains advised in the now-prompt Mar contract with a recovery above 3.58 required for shorter-term traders to move to the sidelines and longer-term players to pare bearish exposure to more conservative levels. Subsequent strength above 3.70 is required to confirm the bullish divergence in momentum of a scale sufficient to not only break the nearly-5-month downtrend, but reinforce a count that would call for prices potentially $0.80-to-$1.00 higher before $0.20-cents lower. In lieu of such strength however, another round of new lows below 3.49 should not surprise.


