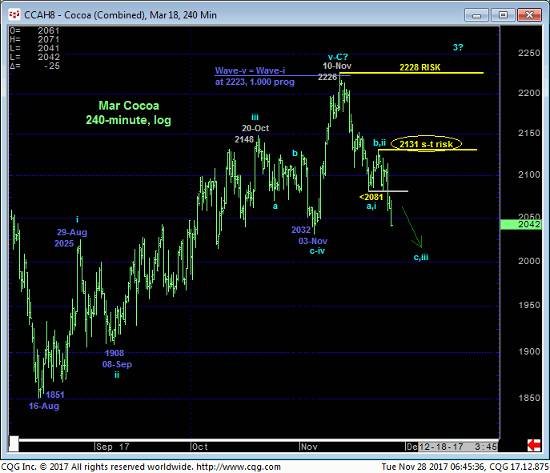
Yesterday’s break below 20-Nov’s 2081 initial counter-trend low may not look like much, but for mounting reasons we’ll discuss below it could be the second baby step in a peak/reversal process that could result in a resumption of the secular bear trend to eventual new lows below 03May17’s 1772 orthodox low. Minimally, this resumed slippage leaves 22-Nov’s 2131 high in its wake as the latest smaller-degree corrective high this market is now required to recoup to break what is at least a new intermediate-term trend down. In this regard 2131 is considered our new short-term risk parameter from which non-bullish decisions like long-covers and cautious bearish punts can now be objectively based and managed.
Furthermore, yesterday’s resumption of the preceding break from 10-Nov’s 2226 high in the Mar contract raises the odds that that 2226 high COMPLETED a textbook 5-wave Elliott sequence from 16-Aug’s 1851 low as labeled in the 240-min chart below. The Fibonacci fact that the suspected 5th-Wave in this sequence equaled (i.e. 1.000 progression) late-Aug’s 1851 – 2025 1st-Wave of the sequence given that the 3rd-Wave “extended” would seem to reinforce this count.


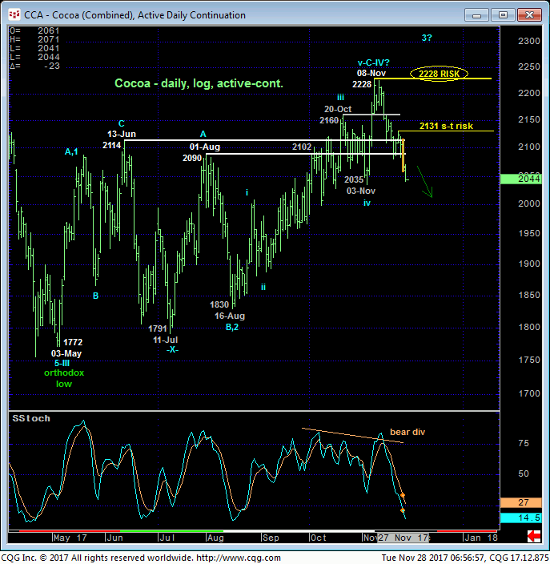
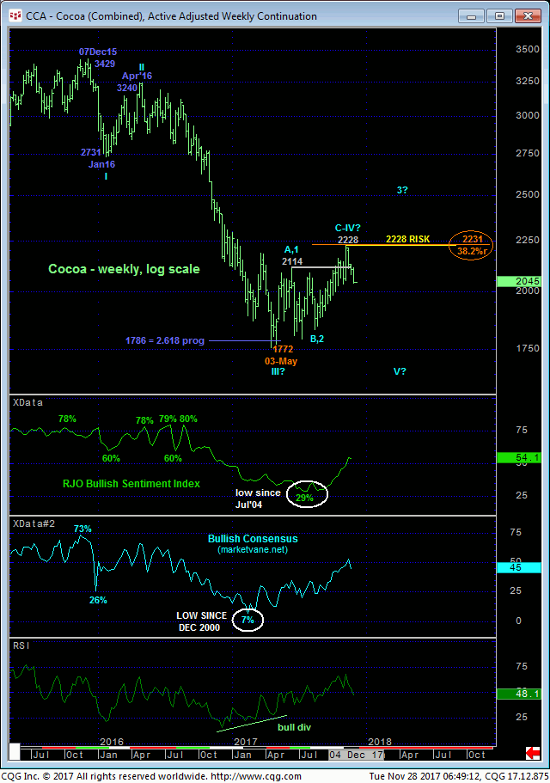
Contributing mightily to this peak/reversal threat are a number of factors shown in the daily (above) and weekly (below) log scale charts, including:
- the market’s gross failure to sustain early-Nov gains above a TON of former resistance from the 2090-to-2160-range that should have held as new support if the market was still truly strong “up here”
- the textbook 5-wave count from the 16-Aug low cited above that arguably completes a
- textbook 3-wave and thus corrective recovery from 03-May’s 1772 orthodox low and
- May-Nov’s recovery coming within three ticks of the (2231) 38.2% retrace of the prospective 3rd-Wave down from Apr’16’s 3240 high to May’17’s 1772 low!
Left unaltered by a recovery above 08-Nov’s increasingly important 2228 high and new key risk parameter, these technical facts warn that the entire May-Nov recovery attempt is a mere correction within the secular bear trend from Dec’15’s 3429 high ahead of a resumption of that major downtrend that preceded it. In this longer-term regard that 2228 high on an active-continuation chart basis is considered our new long-term risk parameter from which all non-bullish decisions like long-covers and new bearish exposure can be objectively based and managed. And if correct this wave count warns of prospective weakness to levels below 03-May’s 1772 orthodox low.

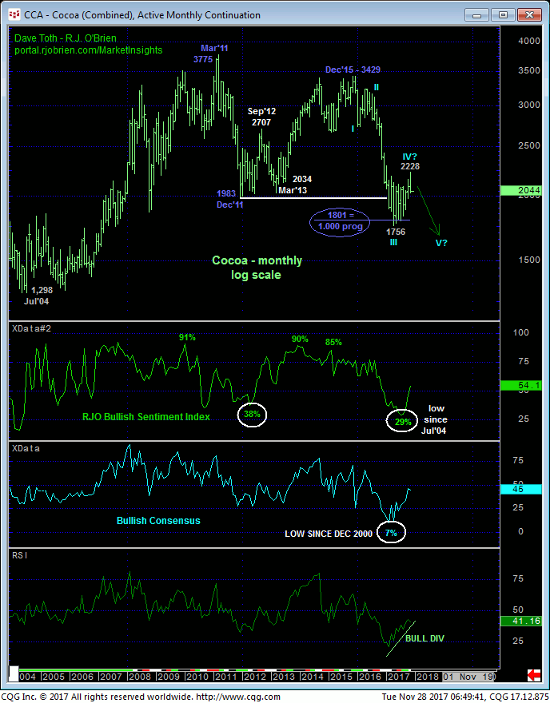
Given the extent and impulsiveness of Aug-Nov’s rally we have warned over the past month or two of the developing prospect for a major BASE/reversal count given what was historically bearish sentiment and the Fibonacci fact that the decline from Dec’15 high of 3429 basically equaled 2011’s preceding 3775 – 1983 decline in length (i.e. 1.000 progression). This count could easily still be intact. However, the peak/reversal-threat facts cited above will remain intact until and unless this market recoups 08-Nov’s 2228 high and new key risk parameter. In lieu of such and given May-Nov’s Fibonacci MINIMUM 38.2% retrace of a prospective 3rd-Wave from 3240 to 1772, this year’s recovery attempt falls well within the bounds of a mere correction on a very long-term basis shown in the monthly log scale chart below. And if correct, the secular bear market arguably dating from Mar 2011’s 3775 high could be poised to resume to eventual new lows below 1772.
These issues considered, traders are advised to neutralize all previously recommended bullish exposure at-the-market and first approach rebound attempts to the 2080-area as corrective selling opportunities. Minimum strength above 2131 is required to defer or threaten this call and provide an objective opportunity to pare of cover new bearish exposure. Ultimately however a recovery above 2228 is required to nullify this new bearish count, reinstate the bull and a base/reversal count that could be major in scope. In lieu of such 2228+ strength we believe this market may be poised for a multi-month resumption of the secular bear market to eventual new lows below 1772. We will now be on the lookout for labored, corrective behavior on smaller-degree recovery attempts for reinforcing evidence of this bearish call and also for favorable risk/reward selling opportunities.


