This week’s reading of the EIA Petroleum Status Report, crude oil inventories declined in the US by -3.4 million barrels. Compared to last week’s inventory draw of -1.9 million barrels, as crude has held onto the majority of its November gains. Demand remains consistent since, US refineries have been brought back online, and we are seeing consistent draws on crude inventories, suggesting that there has yet to be a flood of supply to this market. With the recent news of the Keystone pipeline spill, the market immediately responded as if oil was in short supply. The market witnessed forward months (winter months like January and February) trade at a premium to back month (spring and summer months like April, May, June, etc.). This inversion in the curve represents the market’s fundamental reaction to a short-term supply crunch, and without a continued rally in crude futures, the market may not believe in the original supply shortage the market began to price in.
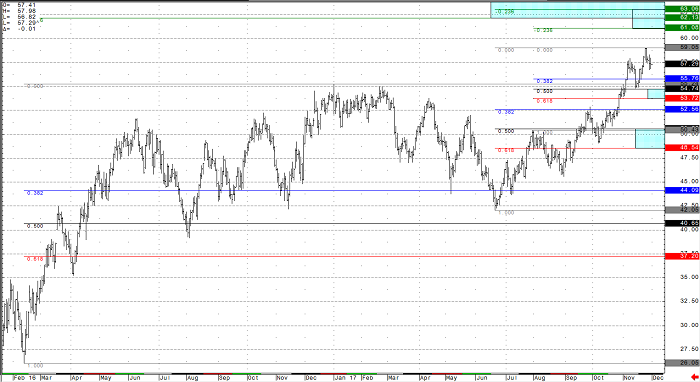
From a technical perspective, WTI crude oil futures have continued to trend higher from the mid-summer lows in the continuous contract. Below I have included a daily bar chart, outlining some of the important price levels that could produce a reaction in the crude market. The most important of which, is the 55.24 high from December of 2016, which the market is currently finding as support now that it has closed securely above. Below those prior highs, the 54.79 and 50.50 50% Fibonacci inflection zones are the next key downside support levels bulls should pay attention to. To the upside, resistance will likely be found into the 60.00 handle, as the fundamental trade suggest a significant price barrier there (as this is where US shale becomes profitable, and likely will flood the market with ample supply). Technical upside projections come in around 62.50, as a target zone from the previous Fibonacci support levels.
In my opinion, crude oil futures are now above a short term line in the sand, where a breakout higher could be imminent. I am cautiously optimistic that the 55.00 area will now hold as support and give way to a rally higher, however, the closer to 60.00 a barrel the market gets the higher probability more oil wells and rigs will be brought online (if they aren’t already) to meet demand. With global production nowhere near its full capacity, the price of WTI oil likely remains capped in the near term (where that level is however, remains the battle), but the trend is up until it fails. However, if the price of WTI crude cannot break through its multi-year ceiling, there is the risk of a larger timeframe range still being underway (with its low end down into the $40’s).
Crude Oil Daily Chart


