With the whole world turning its eyes to crypto currencies, real tangible assets have taken a beating over the last few months. The exception to this trend, are energy products, being led by WTI Crude in the near term. There is a strong trend in the adoption of crypto currencies, particularly Bitcoin, and this coin actually creates very real drain on the energy grid; therefore energy products may be in higher demand, as crypto currencies consume large amounts of energy. With that being said, there is still very real demand for WTI crude being confirmed by the EIA petroleum status report (from Wednesday, December 13th), which has seen 5 million barrels draws for two weeks in a row. This week’s reading of -5.1 million barrels, is only slightly weaker than last week’s draw of -5.6 million barrels. On the other hand, and slightly worrisome, Gasoline inventories saw builds (6.8 million barrels last week, and 5.7 million barrels this week). Even though this is a signal for a slowdown in petroleum consumption, it’s more than likely the result of refineries increasing capacity to meet a future jump in demand.
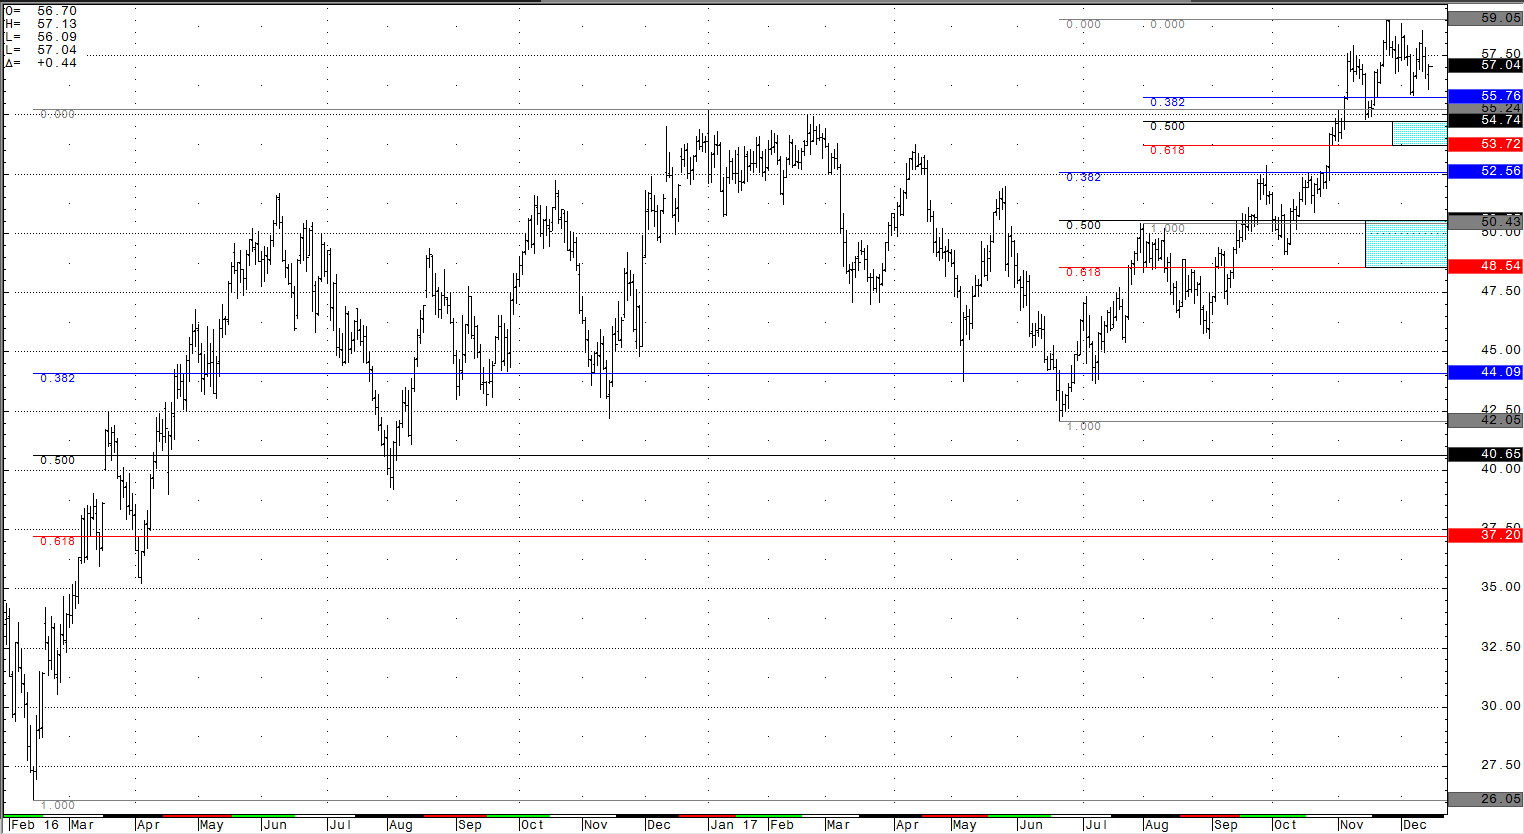
From a technical perspective, WTI Crude has been caught in a generally tight range over the last month. Trading between approx. 59.00 to the upside, and approx. 56.00 to the low side, the current front month future finds itself right in the middle. Below I have included a daily bar chart, outlining some of the important price levels that could produce a reaction in the crude market. The most important of which, is the 55.24 high from December of 2016, which the market his currently finding as support now that it has closed securely above. Below those prior highs, the 54.79 and 50.50 50% Fibonacci inflection zones are the next key downside support levels bulls should pay attention to. To the upside, resistance will likely be found into the 60.00 handle, as the fundamental trade suggest a significant price barrier there (as this is where US shale becomes profitable, and likely will flood the market with ample supply). Technical upside projections come in around 62.50, as a target zone from the previous Fibonacci support levels.
In my opinion, crude oil futures are now above a short term line in the sand, where a breakout higher could be imminent. I am cautiously optimistic that the 55.00 area will now hold as support and give way to a rally higher, however, the closer to 60.00 a barrel the market gets the higher probability more oil wells and rigs will be brought online (if they aren’t already) to meet demand. With global production nowhere near its full capacity, the price of WTI oil likely remains capped in the near-term (where that level is however, remains the battle), but the trend is up until it fails. However, if the price of WTI crude cannot break through its multi-year ceiling, there is the risk of a larger timeframe range still being underway (with its low end down into the $40’s).
Crude Oil Daily Continuation Chart


