FEB GOLD
In 14-Dec’s Technical Blog following 13-Dec’s bullish divergence in short-term momentum above 1253.4, we discussed the prospect for an interim bottom. Nearly two weeks on and after Fri’s accelerated gains the bull’s prospects have taken a more important step by recovering above a ton of former 1264-area support-turned-resistance that we’ll discuss more fully below. The 240-min chart below shows that the market has not only retraced more than 61.8% of Nov-Dec’s 1301 – 1238 decline, but appears to be accelerating, with Fri’s gains leaving that day’s 1268.4 low in their wake as the latest smaller-degree corrective low this market is now minimally required to fail below to stem the rally. Per such this 1268.4 low is considered our new short-term risk parameter from which non-bearish decisions like short-covers and cautious bullish punts can be objectively rebased and managed.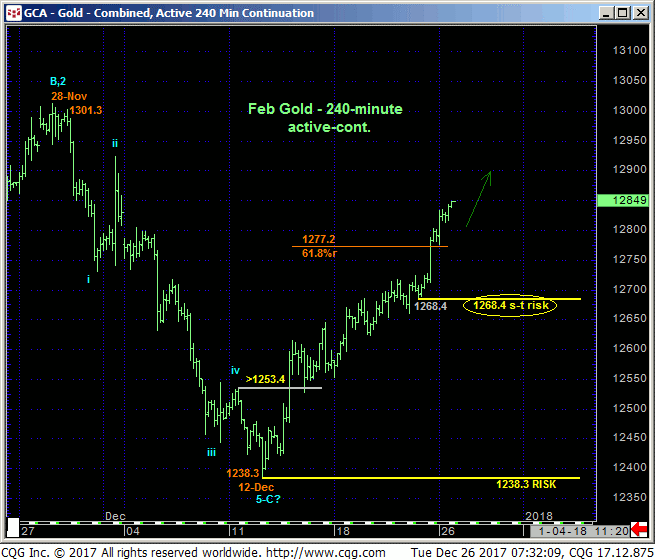
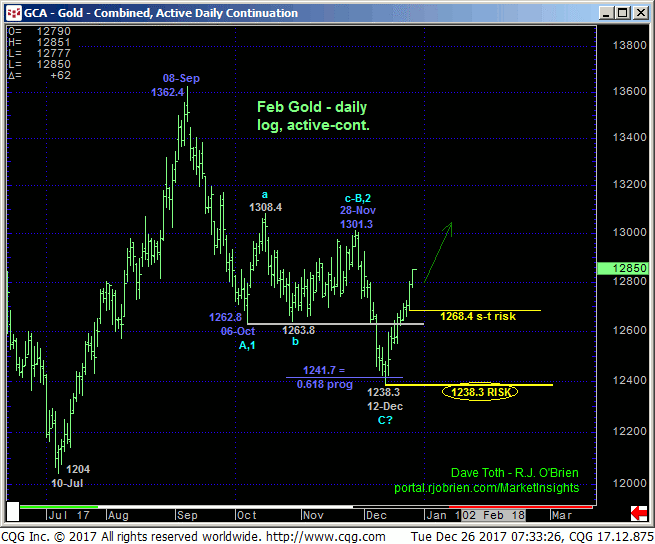
Contributions to a broader bullish count include:
- the market’s gross failure to sustain early-Dec’s losses below fully two months of former 1264-area support-turned-resistance shown in the daily log chart above
- a 3-wave and thus corrective sell-off attempt from 08-Sep’s 1362.4 high that warns of a resumption of this year’s earlier uptrend that preceded it
- the decline from 28-Nov’s 1301.3 high spanning a length just a couple bucks removed from the (1241.7) 0.618 progression of Sep-Oct’s preceding 1362.4 – 1262.8 decline and
- the market’s rejection of the exact (1237.6) 50% retrace of Dec’16 – Sep’17’s 1124.3 – 1362.4 rally on a weekly log scale chart below.
It’s also noteworthy for a broader bullish count that Nov-Dec’s decline eased the frothy bullish sentiment in our RJO Bullish Sentiment Index that prohibited a bullish count following 30-Nov’s bearish divergence in momentum. Dropping from a historically extreme 96% froth to a relatively luke warm 74%, this market has basically nullified its vulnerability to lower prices and, most importantly, identified 12-Dec’s 1238.3 low as THE key level and longer-term risk parameter it’s now got to relapse below to resurrect any broader bullish count.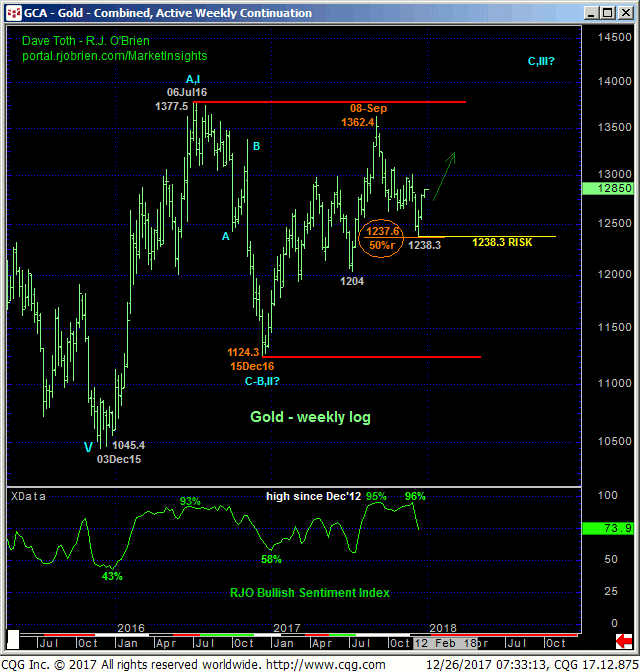
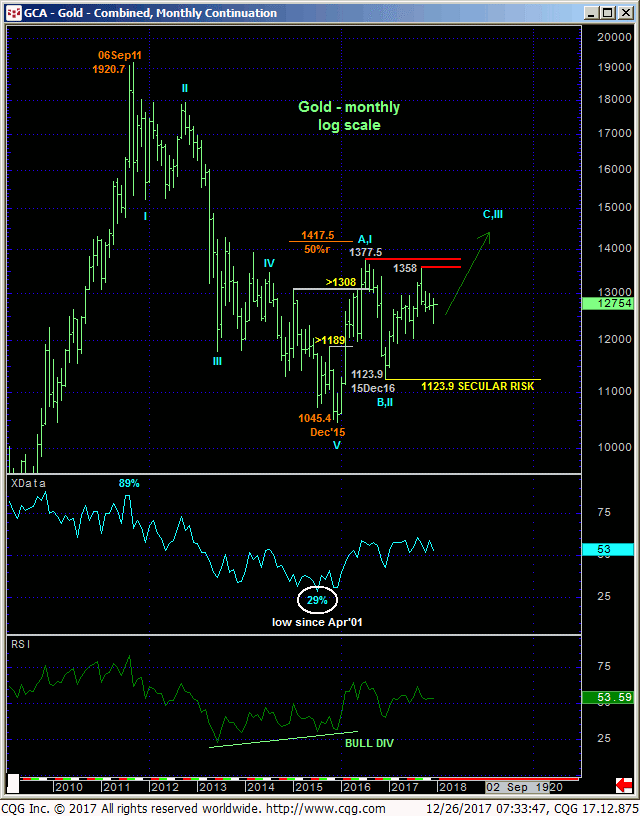
To be sure, the weekly chart above and monthly log chart below show the market still deep within the middle-half bowels of a 1377 – 1124-range that arguably dates back nearly TWO YEARS. There could be oodles of aimless lateral trading range behavior remaining within this range. But traders are reminded that this range also remains well intact as a corrective/consolidative range that is a subset of a BASE/reversal process that could be major in scope and warn of eventual huge gains above Jul’16’s 1377 initial counter-trend high following early-2016’s break of the preceding 2011 – 2015 seculat bear trend.
It would be grossly premature to conclude that the past couple weeks’ increasingly impressive but yet intra-range rally IS the resumption of what we believe is a new secular bull trend in gold prices. However, it would also be premature to conclude this rally ISN’T part of that resumed bull. These issues considered, Longer-term players are advised to neutralize any previously advised bearish policy and exposure and join shorter-term traders in first approaching setback attempts to the 1280-level OB as corrective buying opportunities with weakness below 1268.4 required to defer or threaten this call enough to warrant returning to the sidelines. In lieu of such sub-1268.4 we anticipate further and possibly accelerated gains.
MAR SILVER
Fri and today’s continued gains reinforce our bullish call from 20-Dec’s Technical Blog and leave Thur’s 16.14 low in their wake as the latest smaller-degree corrective low this market is now minimally required to fail below to break this uptrend and threaten a broader bullish count. In this regard 16.14 is considered our new short-term risk parameter from which non-bearish decisions like short-covers and cautious bullish punts can be objectively rebased and managed.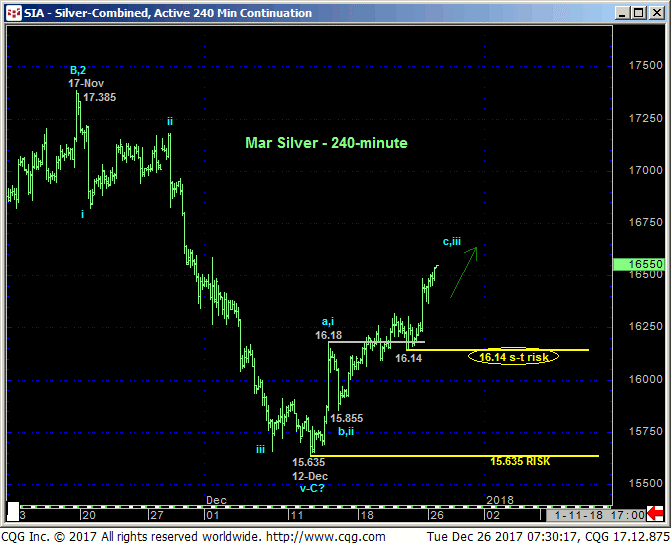
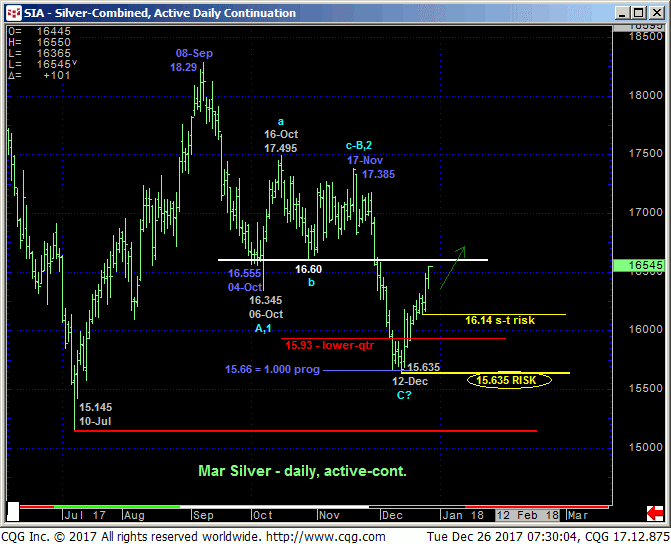
This tight but objective risk parameter at 16.14 may come in handy given the market’s current engagement of a ton of former resistance from the 16.60-area from Oct-Nov shown in the daily active-continuation chart above. If there’s an area that could repel this intra-2017-range recovery attempt it is this one, and we will gauge such a rejection by a confirmed bearish divergence in mo below 16.14. In lieu of such weakness however, the following factors contribute to a broader bullish count that could be extensive in scope:
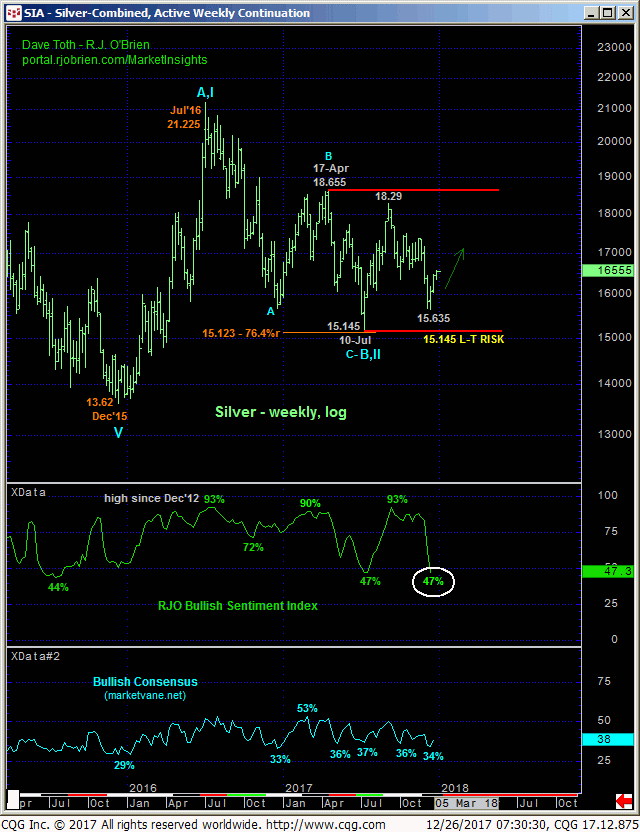
- the market’s rejection of the lower-quarter of this year’s range
- the Fibonacci progression fact that the decline from 17-Nov’s 17.385 high came within 2-1/2-cents of its (15.66) 1.000 progression of the initial decline from 08-Sep’s 18.29 high to 04-Oct’s 16.555 orthodox low amidst
- a return to historically bearish levels of market sentiment shown in the weekly log chart below that have warned of and accompanied significant base/reversal environments in the past.
These issues considered, a bullish policy and exposure from 16.25 OB remains advised with a failure below 16.14 required to threaten this call enough to warrant its cover. In lieu of such weakness we anticipate further and possibly accelerated gains ahead with a clear break above the 16.60-area resistance the next reinforcing evidence of a broader bullish count that could expose a run at the upper-quarter of this year’s range and possibly an eventual breakout above 17-Apr’s 18.655 high.
