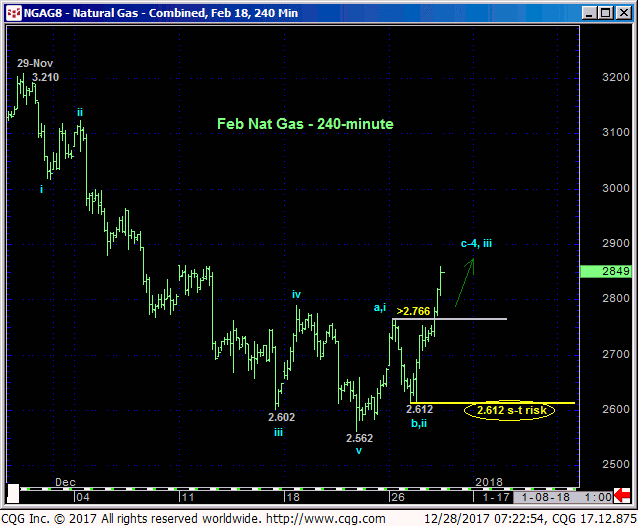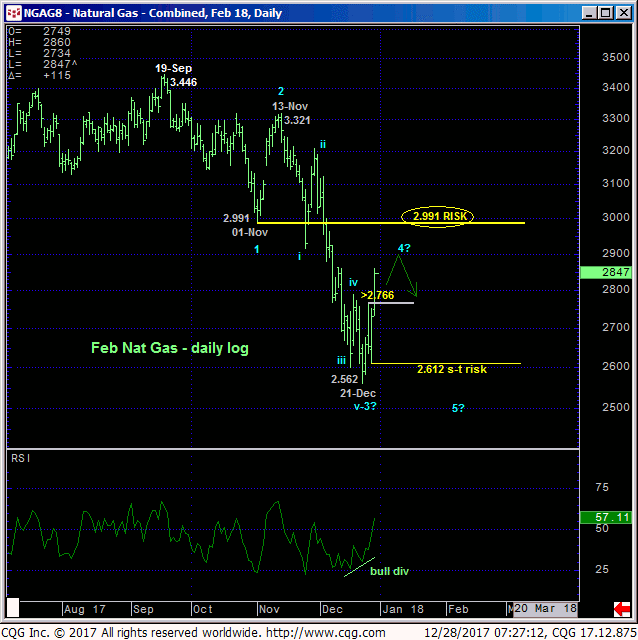
In yesterday’s Technical Blog we identified Tue’s 2.766 high as the level the market needed to sustain losses below to maintain a more immediate bearish count. It’s failure to do so overnight confirms a bullish divergence in momentum that ends the decline from at least 13-Nov’s 3.321 high and confirms at least the intermediate-term trend as up.
An important by-product of this bullish divergence in mo is the market’s definition of yesterday’s 2.612 low as the latest smaller-degree corrective low it must now sustain gains above to maintain a bullish count. Its failure to do so will render the recovery attempt from 21-Dec’s 2.562 low a 3-wave and thus corrective affair consistent with a broader bearish count and expose a resumption of 2017’s major downtrend. Per such 2.612 becomes our new short-term risk parameter from which non-bearish decisions like short-covers and cautious bullish punts can now be objectively based and managed.


The bullish divergence in daily momentum (above) also warns that 21-Dec’s 2.562 low is the END of a 5-wave Elliott sequence from 13-Nov’s 3.321 high. With a massive 11 months’ worth of larger-degree peak/reversal-process behavior PRECEDING that 13-Nov high however, the past week’s recovery attempt easily falls within the constraints of a mere (4th-Wave) correction ahead of still further losses in the weeks and months ahead.
To jeopardize the impulsive integrity of such a broader bearish count, continued impulsive behavior above 01-Nov’s 2.991 (suspected 1st-Wave) low is now required. Per such, we are raising our longer-term bear risk parameter to 2.991.
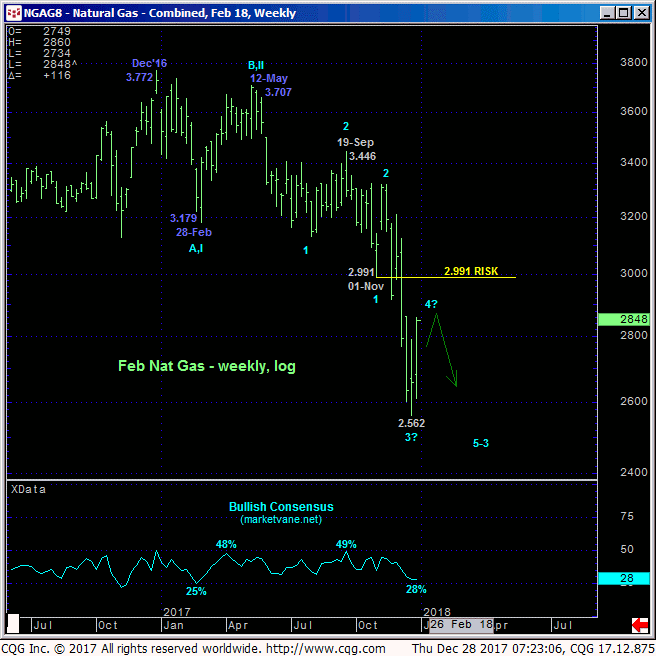
Not to be missed within this base/reversal-threat environment stemming from today’s bullish divergence in momentum is the fact shown in the weekly log chart below that the Bullish Consensus (marketvane.net) measure of market sentiment has eroded to a historically low 28%, its lowest level since Feb’17 that warned of and accompanied Feb-May’s extensive corrective recovery.

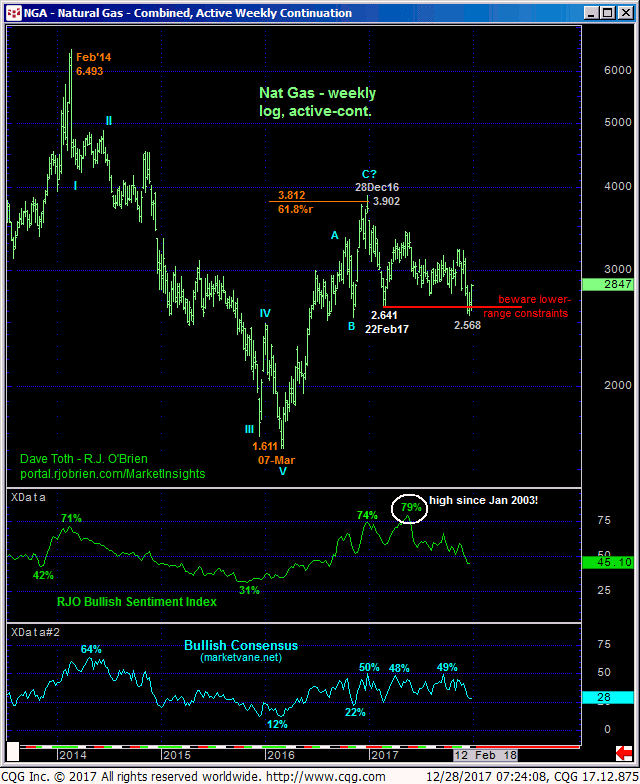
Additionally, on a weekly log active-continuation basis the chart below shows the market’s rejection thus far of the area around the 2.64-handle that defines the lower boundary of this year’s range. The market’s failure to sustain recent sub-2.64 losses is an indication of “non-weakness” that, along with bearish sentiment, could lead to another more extensive, if intra-range rebound.
These issues considered, all but the longest-term traders have been advised to pare or neutralize bearish exposure following overnight’s break above 2.766 and are further advised to move to a neutral/sideline position in order to circumvent the heights unknown of a correction or reversal higher. Against the backdrop of this year’s broader downtrend however, we believe “chasing” bullish exposure on this current rally to be a poor risk/reward bet. Very long-term players are OK to maintain a more conservative bearish policy with commensurately larger-degree strength above 2.991 required to negate this call and warrant its cover.


