FEB CRUDE OIL
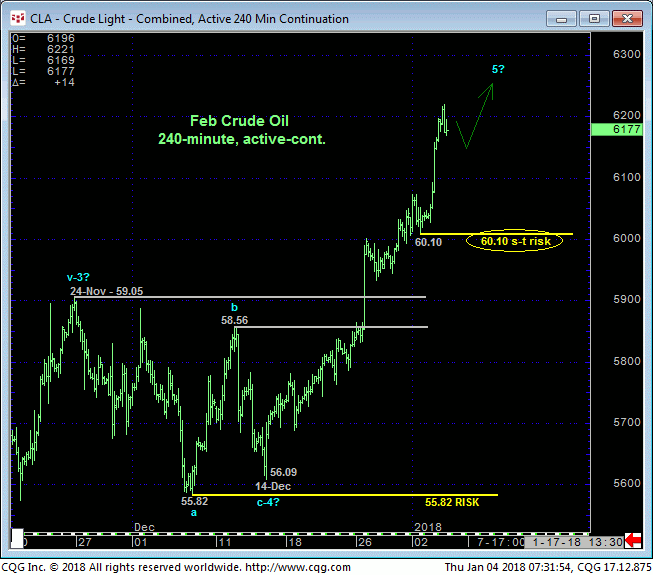
Yesterday’s extended gains to another round of new highs for the 2-YEAR bull and to the highest levels since May’15 leave Tue’s 60.10 low in their wake as the latest smaller-degree corrective low this market is now minimally required to fail below to even defer the bull, let alone threaten it. Per such 60.10 is considered our new short-term risk parameter from which shorter-term traders can objectively rebase and manage the risk of a still-advised bullish policy.

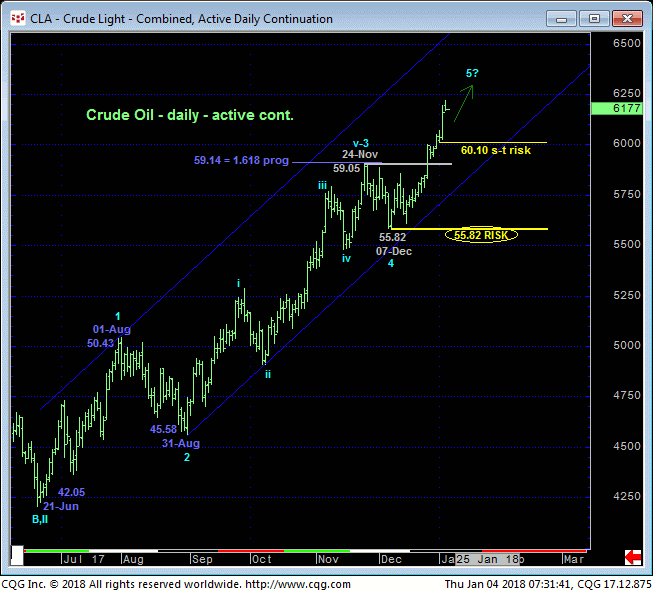
On a broader scale the daily chart below shows the still-developing uptrend from 21Jun17’s 42.05 low that has 07-Dec’s 55.82 low as the latest larger-degree corrective low and key risk parameter this market is required to fail below to, in fact, break the clear and present uptrend. Former 59.05-area resistance from late-Nov is considered new key support.
From an Elliott Wave perspective it’s easy to see the prospect that the rally from 07-Dec’s 55.82 low might be the completing wave of a 5-wave sequence from last Jun’s low. But until and unless this market proves weakness below even former 59.05-area resistance-turned-support, let alone 07-Dec’s 55.82 corrective low and key risk parameter, there’s no way to know that this market isn’t in some “extended” wave sequence higher that would be characterized by accelerated gains.

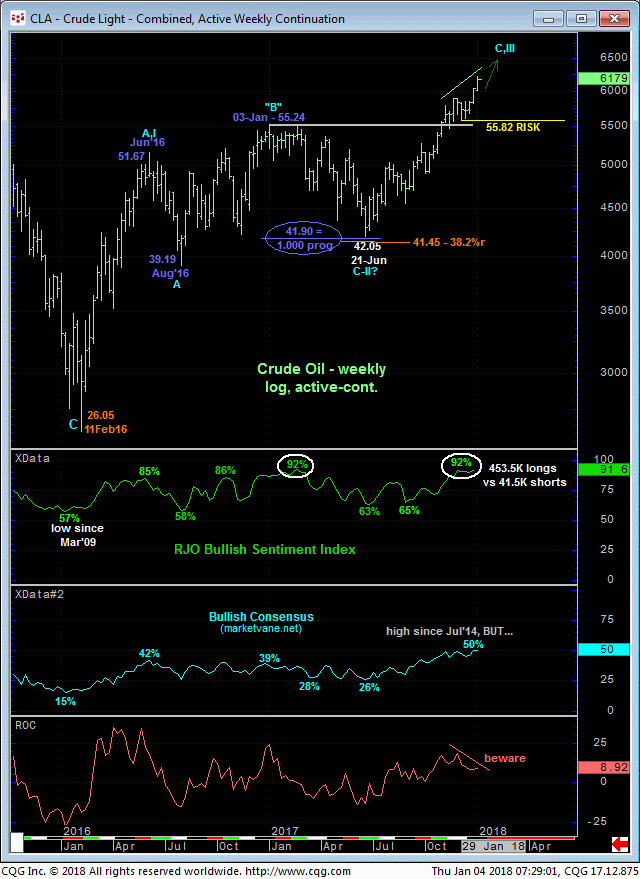
The weekly log chart below shows our proprietary RJO Bullish Sentiment Index of the hot Managed Money positions reportable to the CFTC at understandably historically frothy levels typical of major PEAK/reversal threat environments. But here again, traders are reminded that sentiment/contrary opinion indicators are not applicable technical tools in the absence of an accompanying confirmed bearish divergence needed to break the clear and present uptrend. Herein lies the importance of identifying corrective lows and risk parameters like 55.82. In lieu of weakness below such a risk level, frothy bullish sentiment can remain indefinitely while the bull continues to indeterminable heights.

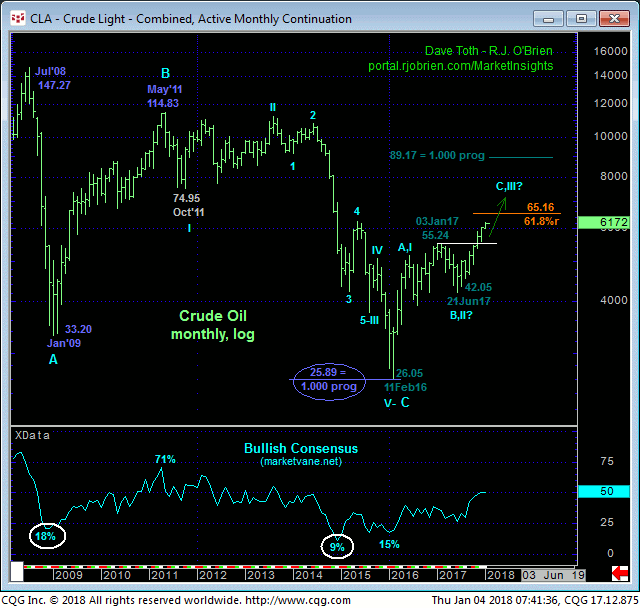
The monthly clog chart below confirms that the trend is up on all scales and should not surprise by its continuance or acceleration. Nov’s breakout above 03Jan17’s 55.24 high reaffirmed our major base/reversal count introduced in 18Feb2016’s Technical Blog that concluded 11Feb16’s 26.05 low as the end of the secular bear market from May’11’s 114.83 high and start of a major correction or reversal of that entire 4-1/2-year bear. We have loosely targeted the 65-to-90-range for this market’s upside potential in the quarters and perhaps years ahead based on the 61.8% retrace of the 2011 – 2016 decline from 114.83 to 26.05 and the 1.000 progression of 2016’s rally from 26.05 to 55.24 from Jun’17’s 42.05 low. Obviously such merely derived levels must be taken with a grain of salt. But until and unless this market fails below at least 55.82, ANY amount of upside is in play in the months, quarters and even years ahead.
In sum, a bullish policy and exposure remain advised with a failure below 60.10 required for shorter-term traders to step aside and longer-term players to pare bullish exposure to more conservative levels. In lieu of such weakness further and possibly accelerated gains remain expected.


