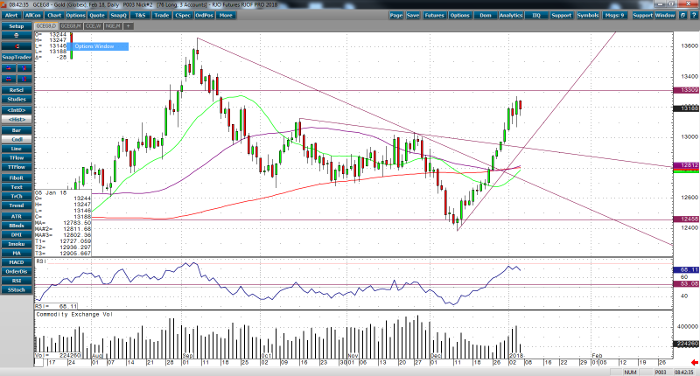
In the early morning trade, February gold is currently off its overnight highs and well off yesterday’s high, currently trading at $1315.9. Yesterday, gold finally traded with significant volume compared to the last three weeks, which was the start of a $90 rally that started back on December 12. Unfortunately for the Bulls the March US dollar is showing signs of life which might cause a selloff in the shiny one back down to at least $1,300.0 an ounce. Most of this rally has been off very low volume over the holiday season and the fear over Iranian protest have probably already been priced in. Furthermore, the higher prices have dampened demand out of Asia which might also be another sign of a short-term top in the gold market.
If we take a quick look at the February daily gold chart, you can clearly see the massive short-term rally that took out all downtrend lines and also see how the volume was much lower than the average. Even with the golden cross that has formed in the February gold chart, you can still look for a selloff and a price retest back to $1,290.0 or so. However, look for the bulls to come back in strongly around that price level.
Gold Feb ’18 Daily Chart


