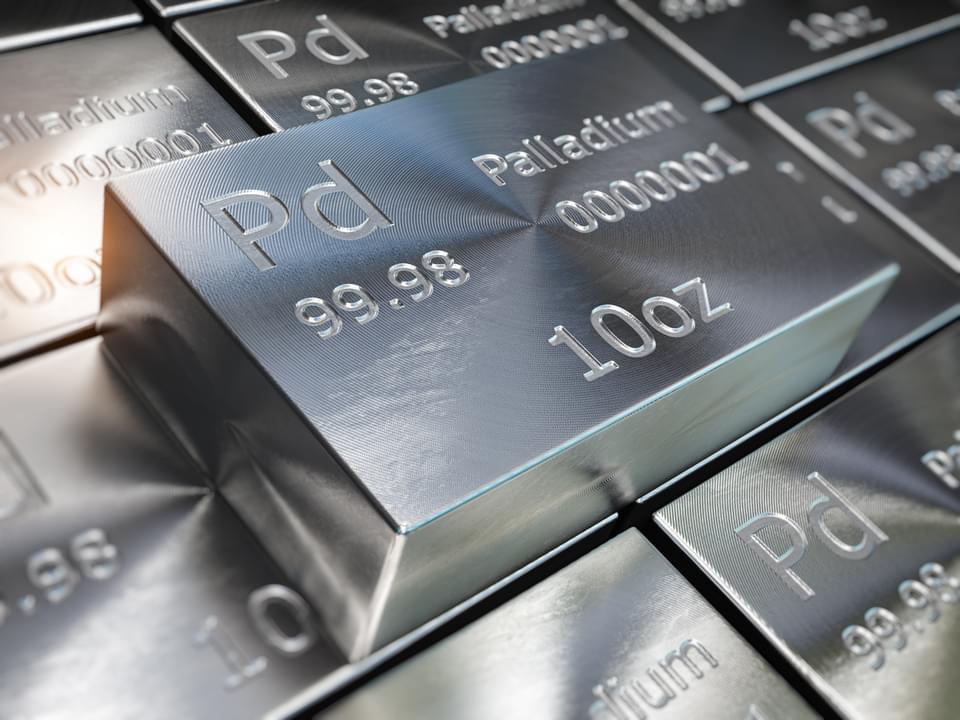
It’s no secret that palladium was the best performing commodity in the past year rising by 48% with lumber as its only close competitor up 38%. The main catalyst for the rally is that palladium is used primarily in catalytic converters. Now with global auto sales approaching 90 million per year and significant growth in electric cars still five years away we can expect the war over air pollution to be front and center. Besides auto sales another indicator to watch is rhodium prices. Similar to palladium, rhodium’s main use is the application to clean vehicle emissions and due to the rarity prices have become volatile. Rhodium prices moved over 122% last year and have reached the highest level since 2011.
Below is a daily chart of March palladium. The latest trend started on December 14 when the breakout over $1020 occurred and with current prices near $1090 your red flag is at $1030. At this point the upward trend would be technically broken. Watch for a new wave of strength on a breakout above $1100.
Palladium Mar ’18 Daily Chart