MAR SOYBEAN MEAL
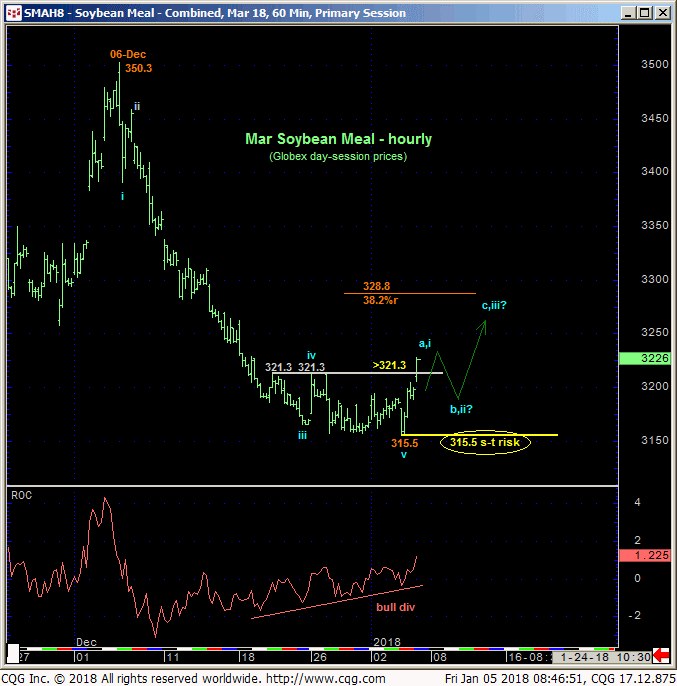
The market’s recovery this morning above a 312.3 corrective high and short-term risk parameter that has been in place since 20-Dec confirms a bullish divergence in momentum that defines yesterday’s 315.5 low as the END of a 5-wave Elliott sequence down from 06-Dec’s 350.3 high and start of a steeper correction or reversal higher. In this regard yesterday’s 315.5 low is considered our new short-term risk parameter from which non-bearish decisions like short-covers and cautious bullish punts can now be objectively based and managed.
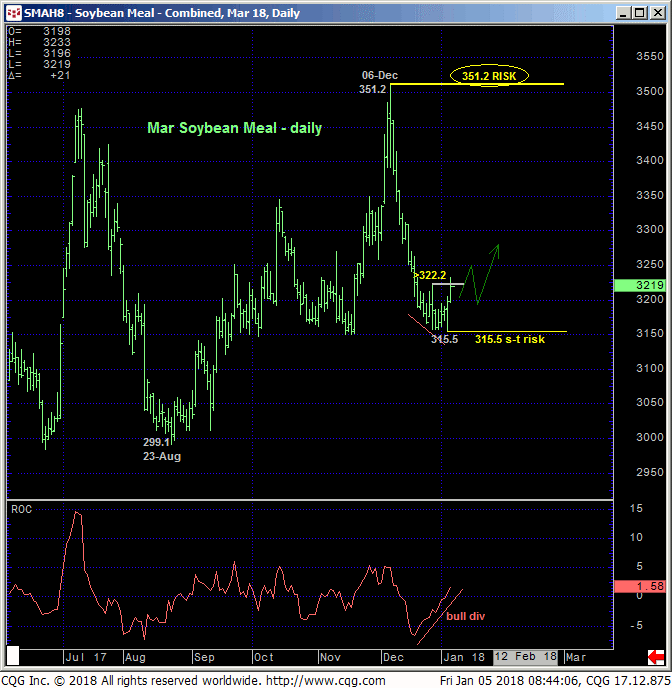
The daily chart above shows this bullish divergence in momentum from the middle of not only the past YEAR’S lateral range, but also the past THREE YEARS’ lateral range. Aimless whipsaw risk typical of such range-center environs has been and remains this market’s biggest challenge and requires a more conservative approach to risk assumption. Herein lies the importance f identifying tight but objective risk parameters like yesterday’s 315.5 low.
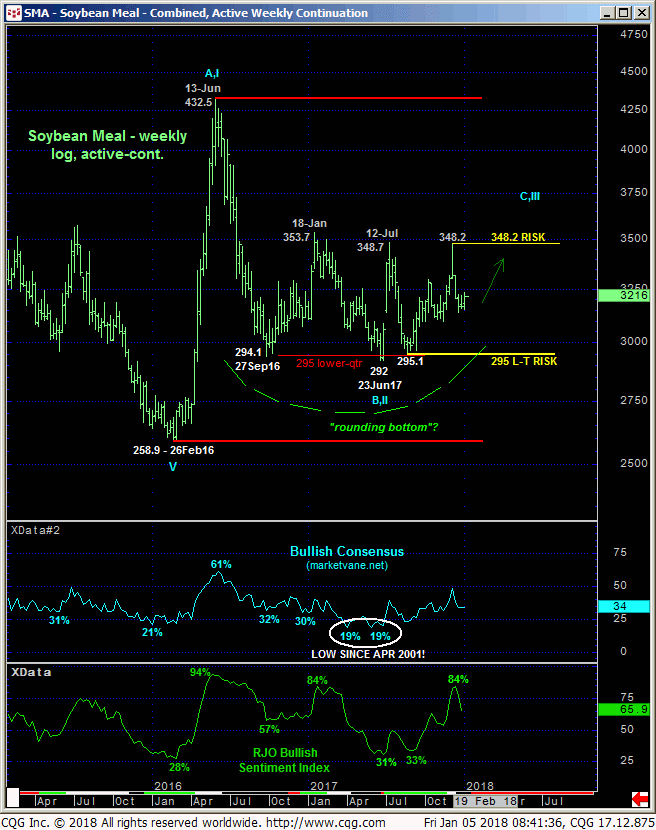
From a long-term perspective it would be presumptuous to conclude a resumption of a major base/reversal “rounding-bottom” pattern from such a small scale momentum failure, especially from deep within the middle-half bowels of such a incessant lateral range. And indeed, a break above 06-Dec’s key 351.2 high and long-term risk parameter remains required to confirm such a bullish count. But against the backdrop of such a major, multi-quarter base/reversal-threat environment that has yet to be mitigated despite multiple attempts over the past 15 months to break even the (295) lower-quarter of this range, it would likewise be presumptuous to think that such a 351+ run hasn’t started.
These issues considered, traders are advised to return to a cautious bullish policy and first approach setback attempts to former 320.0-area resistance-turned-support as corrective buying opportunities with a failure below 315.5 required to negate this call, reinstate the downtrend from Dec’s 351 high and expose another run at the 300-area. In lieu of such sub-315.5 weakness further and possibly surprising gains are expected.
MAR SOYBEANS
While the market has yet to break our short-term risk parameter defined by 26-Dec’s 9.74 corrective high, today’s poke above Tue’s 9.70 initial counter-trend high confirms at least the intermediate-term trend as up and defines 29-Dec’s 9.55 low as the END of a 5-wave Elliott sequence down from 05-Dec’s 10.27 high. In this regard 9.55 is considered our new short-term risk parameter from which non-bearish decisions like short-covers and cautious bullish punts can be objectively based and managed.
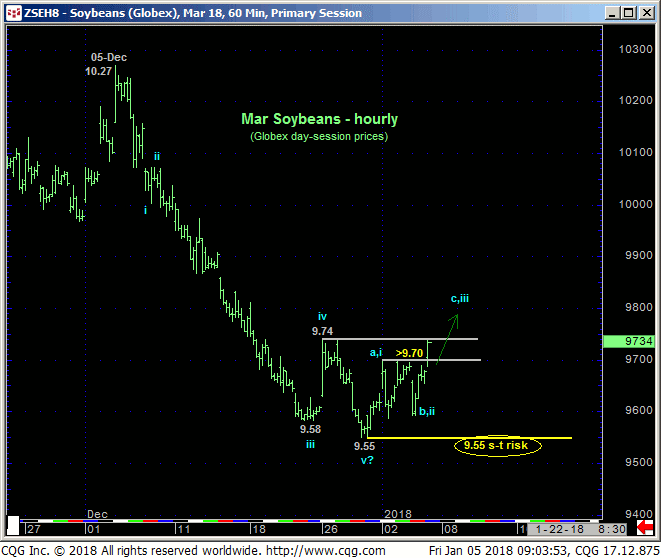
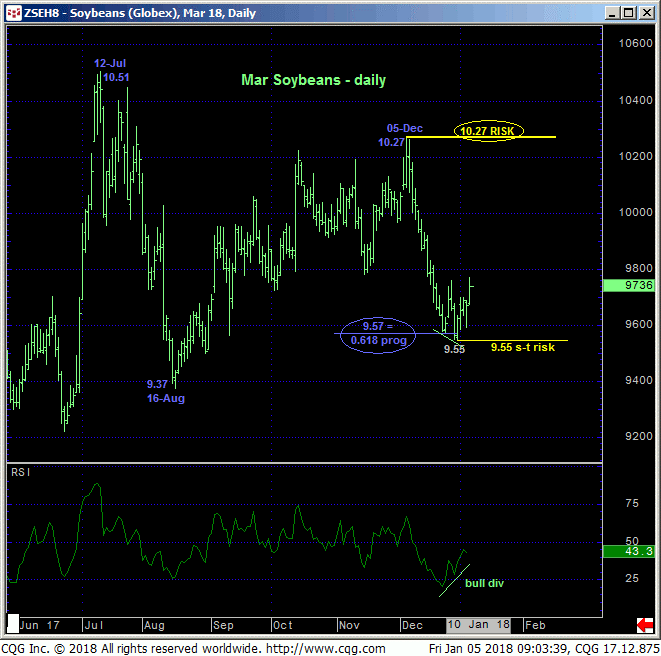
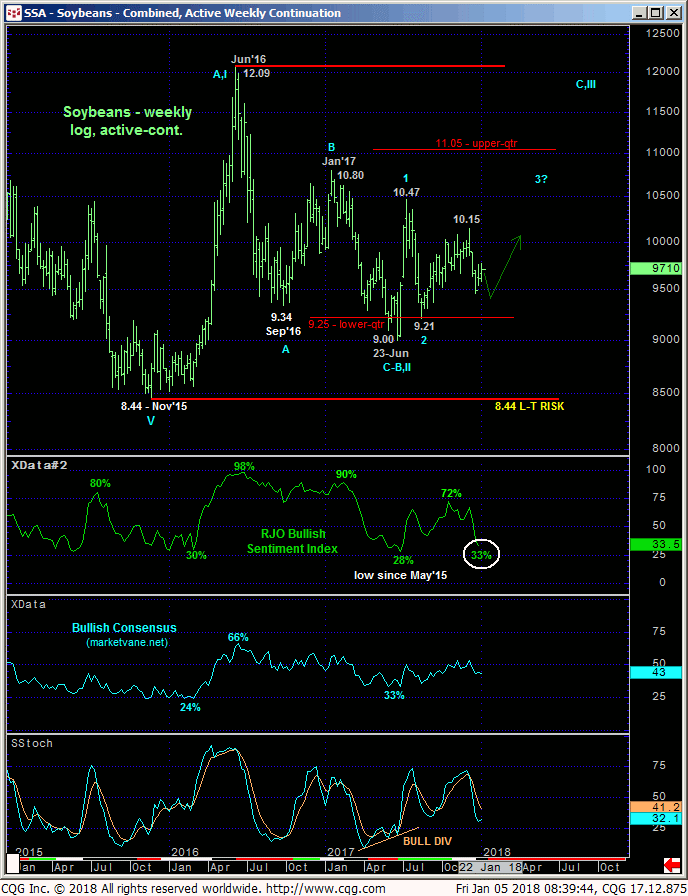
The daily chart above shows the bullish divergence in momentum that breaks the downtrend from 05-Dec’s 10.27 high. At this point it’s premature to conclude either just a correction or a broader reversal higher. But given 1) the Fibonacci fact discussed in 29-Dec’s Technical Blog that the decline from Dec’s 1027 high has spanned a length 61.8% of Jul-Aug’s preceding 10.51 – 9.37 decline amidst 2) a return to historically bearish levels in our RJO Bullish Sentiment Index of the hot Managed Money positions reportable to the CFTC shown in the weekly log chart below, traders should not be surprised by a more protracted rebuttal to Dec’s decline or a resumption of Aug-Dec’s rally to new highs above 10.27 as part of our major, multi-year base/reversal count. A relapse below 9.55 is required to negate this specific call, reinstate Dec’s downtrend and expose a run at 16-Aug’s key 9.37 low.
These issues considered, traders are advised to cover any previously recommended bearish exposure and move to a cautious bullish policy by approaching setback attempts to 9.70 OB as corrective buying opportunities ahead of potentially surprising gains in the weeks ahead. A failure below 9.55 is required to negate this call and warrant its cover.
