As always, we are not in the business of top-picking. And indeed, on even a short-term basis, this market has yet to satisfy even the first of our three reversal requirements: a confirmed bearish divergence in momentum below either a prior corrective low or an initial counter-trend low. But for reasons we’ll expound on below, traders are advised to have a heightened awareness of developing factors that we believe raise the odds of a peak/reversal-threat environment.
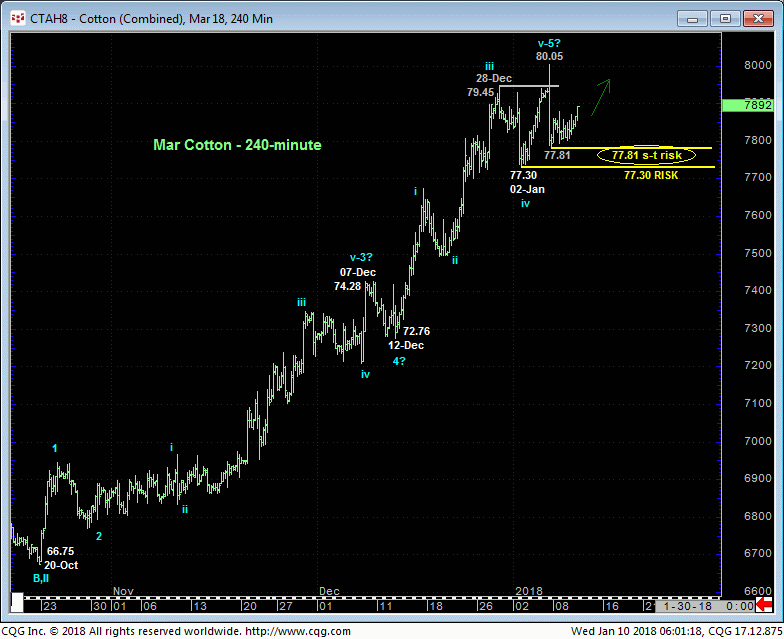
The 240-min chart below details the still-orderly and impressive uptrend from 20-Oct’s 66.75 low. The RATE of ascent has slowed, but the market still needs to prove even short-term weakness by relapsing below an initial counter-trend low like Fri’s 77.81 low. Ideally, a failure below 02-Jan’s 77.30 corrective low would, in fact, confirm a bearish divergence in momentum sufficient to break the 2-1/2-month uptrend. In these regards and, again, for intriguing reasons we’ll discuss below, we’re considering 77.81 and 77.30 as our new short- and longer-term risk parameters to a still-advised bullish policy.
From an Elliott Wave perspective, we’ve labeled what arguably is a complete, extended 5-wave sequence up from 20-Oct’s 66.75 low that “theoretically” may be considered complete. But with so many iterative steps up along the way, there’s really no way to objectively conclude even an interim top until and unless this market proves at least short-term weakness below the bull risk levels identified above. This said…..


…a number of compelling factors have developed that warn us to keep a closer eye on this market’s ability to continue to sustain the simple uptrend pattern of higher highs and higher lows, including:
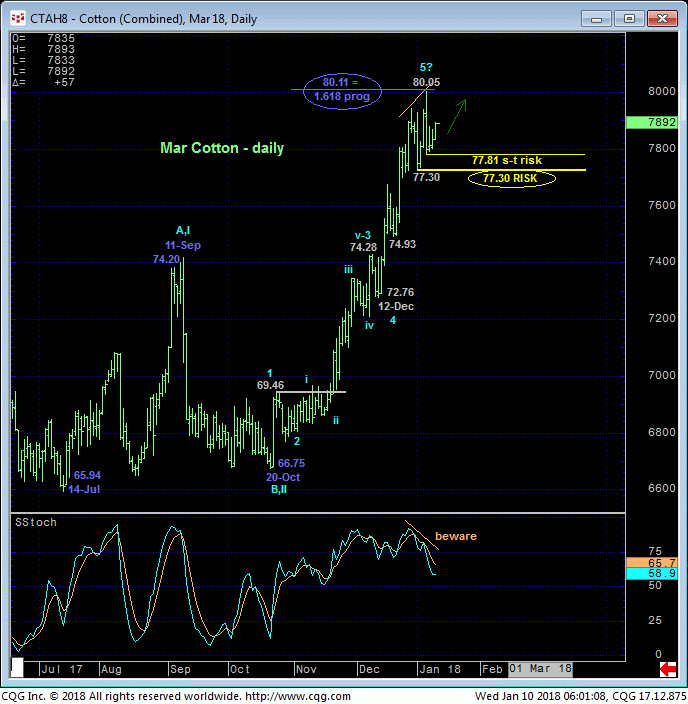
- the nicely developing POTENTIAL for a bearish divergence in momentum (CONFIRMED below at least 77.81 and certainly below 77.30)
- an arguably complete 5-wave Elliott sequence
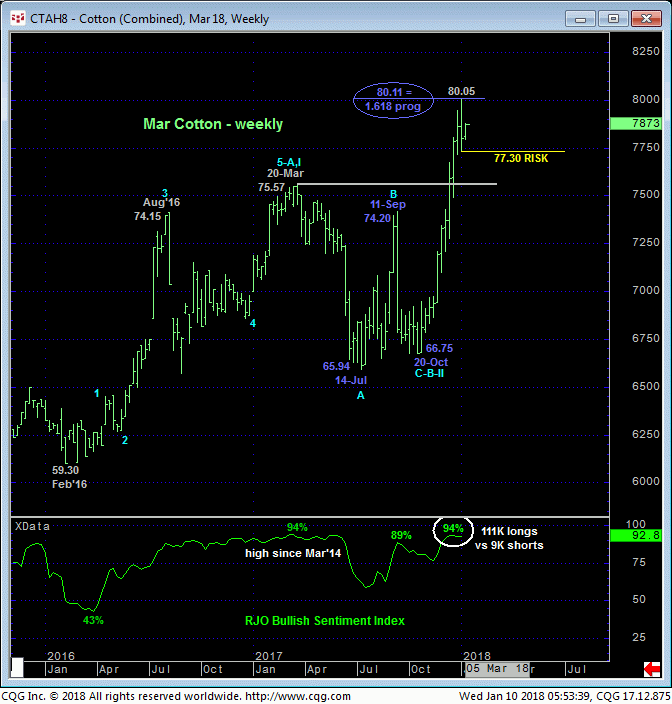
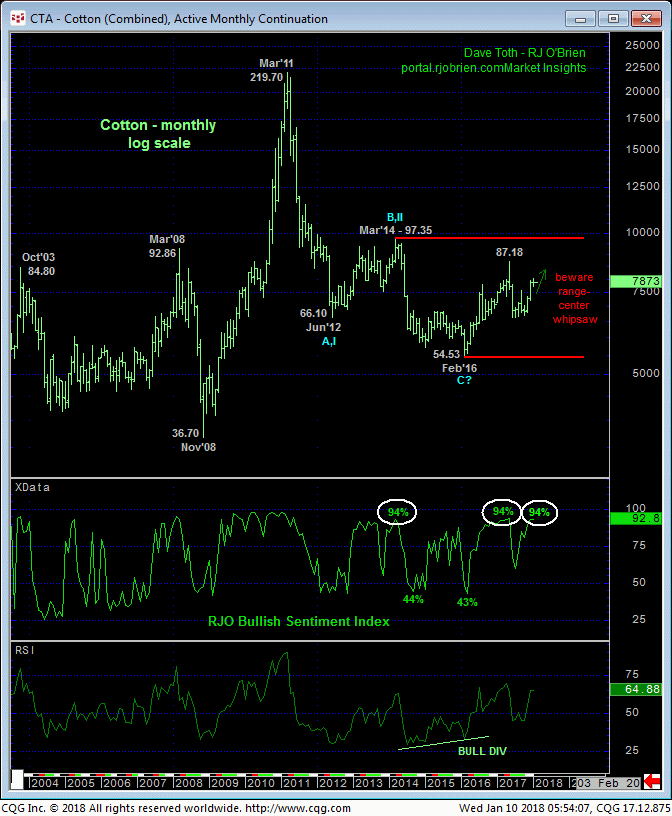
- • historically frothy levels in our proprietary RJO Bullish Sentiment Index that have warned of and accompanied every major peak/reversal environment over the past seven years, and
- the Fibonacci progression fact that Fri’s 80.05 high came within six ticks of the (80.11) 1.618 progression of Jul-Sep’s 65.94 – 74.20 rally from 20-Oct’s 66.757 corrective low.
These are very compelling and unique factors that warn of a peak/reversal-threat environment that, following such a protracted and uninterrupted rally, could expose extensive downside in even a correction. The only thing the market has to do to confirm the threat to the point of non-bullish action like long-covers and new bearish punts is- duh! – stop trending higher. We will gauge this requirement and plan-of-action around 77.81 (tight) and then 77.30.

Finally, we would remind traders that despite all of the technical and fundamental factors that have caused the past couple months’ rally, on a historical basis shown in the monthly log scale chart of the most active futures contract below, the market appears fairly valued in the middle-half of its nearly-six-year range. We are always suspicious of range-center conditions because of the increased odds of aimless whipsaw risk, even on such a massive scale. And an admittedly shorter-term mo failure below even 77.30 cannot be ignored as a threat to the broader bull, especially given the list of factors mounting against the bull.
These issues considered, a bullish policy and exposure remain advised with a failure below 77.81 required for shorter-term traders to step aside and longer-term players to pare bullish exposure to more conservative levels. Subsequent weakness below 77.30 will threaten the longer-term bull enough for long-term players to neutralize any remaining bullish exposure ahead of a correction or reversal lower that could be extensive. In lieu of such sub-77.81 weakness a continuation of the 2-1/2-month uptrend to yet another round of new highs should not surprise.


