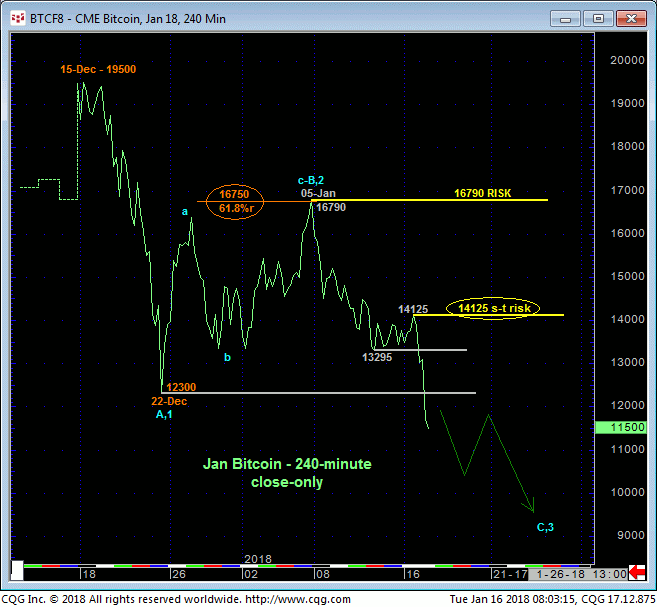
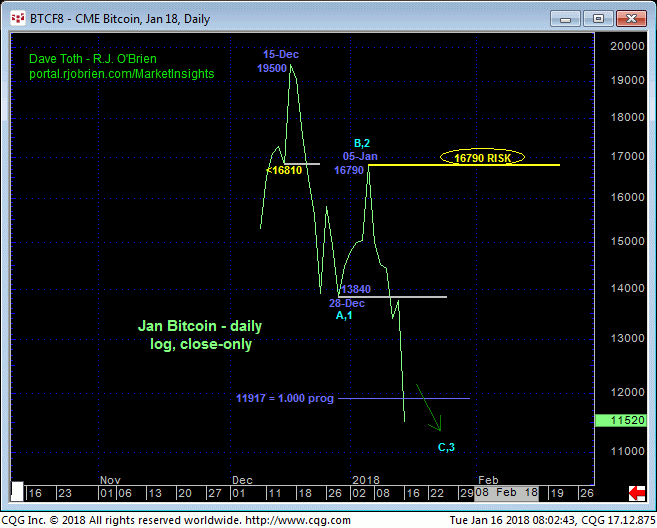
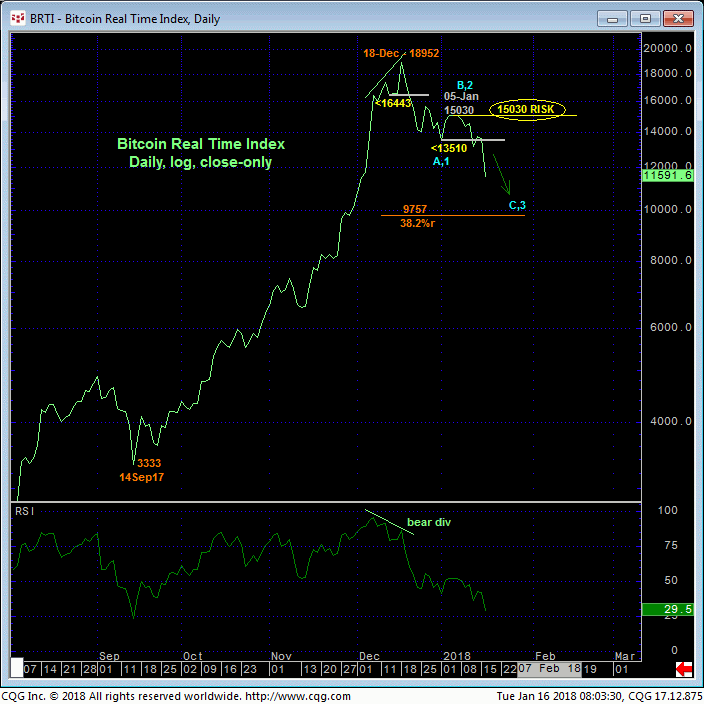
Today’s break below last week and late-Dec lows reinforces at least an interim bearish count introduced in 02-Jan’s Technical Blog following 20-Dec’s bearish divergence in momentum. Only a glance at the 240-min close-only chart above and daily log close-only chart below of the Jan contract is needed to see that AT LEAST the intermediate-term trend is down. The important by-product of this resumed weakness is the market’s definition of recent smaller- and larger-degree corrective highs at 14125 and 16790 that the market is now required to recoup to threaten or negate a more immediate bearish count. Per such these levels represent our new short- and longer-term risk parameters from which a bearish policy and exposure can be objectively rebased and managed. In lieu of such strength, further and possibly accelerated losses should not surprise. Former 12300-to-13295-range support would be expected to hold as new resistance per a more immediate bearish threat.
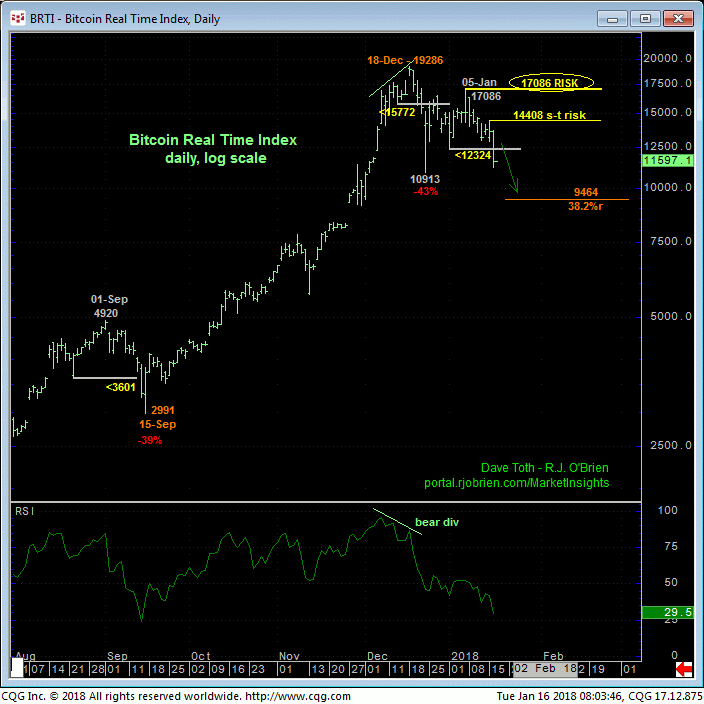
Basis the underlying Bitcoin Index shown in the daily log chart above and daily log close-only chart below, these recent smaller- and larger-degree corrective highs and risk parameters cut across at 14408 and 17086, respectively. More importantly, the extent and impulsiveness of this week’s break below the late-Dec support is the market’s engagement of an area totally devoid of any technical levels of merit. Indeed, the extent and uninterrupted nature of Nov-Dec’s hyperbolic rally left no battlegrounds in its wake that now can be looked to as a support candidate. In effect and on this scale, there is no support. Virtually all technical levels of merit exist only ABOVE the market in the form of former support-turned-resistance and prior corrective highs we have identified above. Until and unless the market recoups these levels, the trend is down and should be expected to continue and perhaps accelerate.
Traders are reminded that ALL merely “derived” technical levels like Bollinger Bands, imokus, trend lines, the ever-useless moving averages and even the vaunted Fibonacci levels we cite often in our analysis NEVER have proven to be reliable reasons to bet on support or resistance without an accompanying momentum failure needed to, in fact, break the trend. And they never will as they are all a FUNCTION OF the underlying market. The tail does not wag the dog.
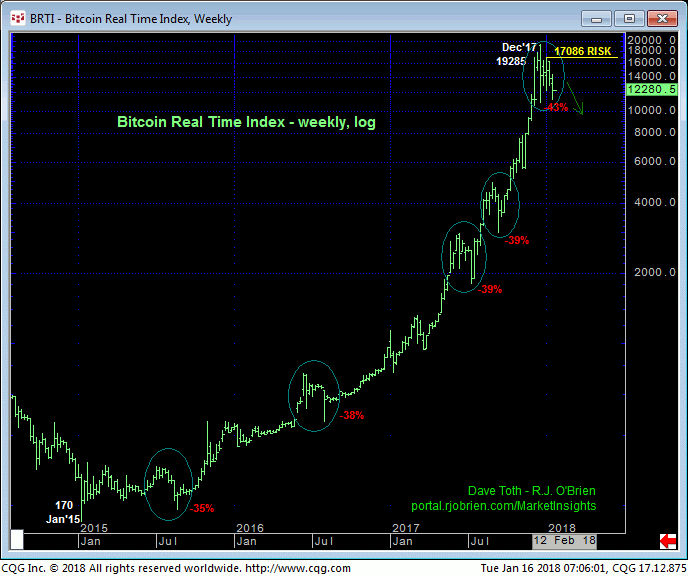
To be sure, the extent of the past month’s sell-off attempt is thus far grossly insufficient to be approached as anything but another correction against the backdrop of the secular uptrend shown in the weekly log chart above. Arguably, on this scale, the secular advance is still ACCELERATING, suggesting that this “dip” is another buying opportunity. But as we suspect most “chasing” this market over the past year or so are likely unfamiliar with arithmetic/linear versus logarithmic performance, even a relatively minor “dip” could easily result in levels thousands of dollars lower and remain well within the realm of a secular bull market.
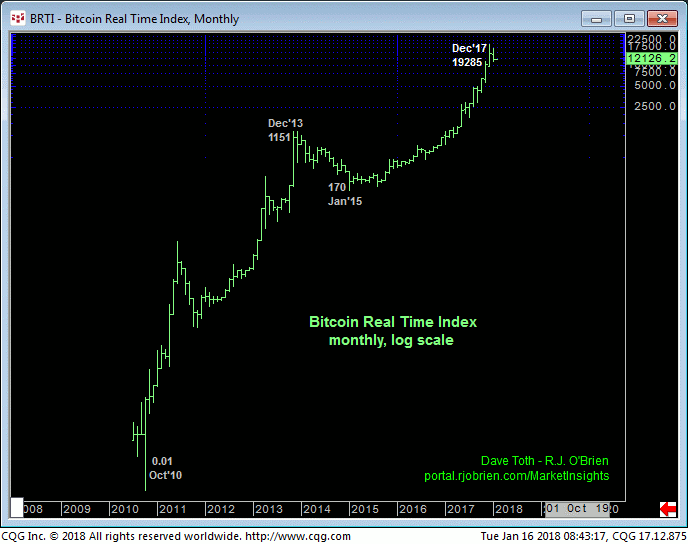
The weekly log scale chart of the underlying Index shows that thus far the past month’s approximate 43% correction is in line with the prior three corrections circled in blue. Until and unless this market recoups the risk parameters identified above however, there is no way to know that the past month’s bearish divergence in momentum isn’t the start of a correction similar to that that unfolded from Dec’13’s 1151 high to Jan’15’s 170 low on a monthly log scale basis below. Against even broader history, that correction looks relatively tame. But it lopped off 85% of the market’s value. A similar 85% scolding from last month’s 19286 high would produce prices in the 3000-area.
We’re not forecasting a move to 3000. But until this market mitigates a more immediate bearish count with strength above specific levels and risk parameters at 14408 and 17086, neither are we ignoring the prospect for such a decline. These issues considered, a cautious bearish policy remains advised with strength above at least 14408 in the Index required to threaten this call. In lieu of such, further and possibly accelerated losses should not surprise.
