FEB CATTLE
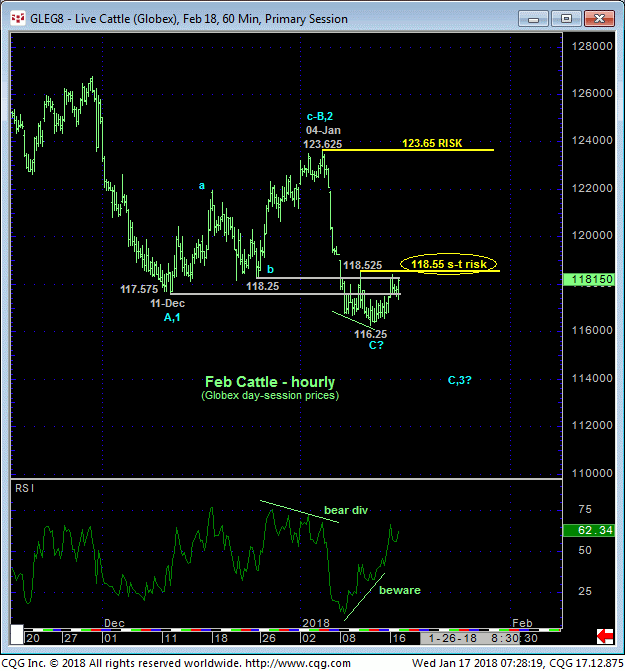
The hourly chart below shows that the potential for a bullish divergence in short-term momentum is developing nicely, but strength above last Wed’s 118.525 corrective high is required to CONFIRM the signal to the point of non-bearish action like short-covers and cautious bullish punts. The fact that this momentum issue has developed around a key 117.575-to-118.25-area of former support-turned-resistance would seem to contribute to the importance of this area as a one around which directional biases and exposure can be more effectively based and managed.
On a broader scale the daily log scale chart below shows that 04-Jan’s 123.65 larger-degree corrective high remains as the key risk parameter this market still needs to recoup to break the downtrend from 06-Nov’s 131.95 high. Recovery attempts shy of 123.65 are still advised to be approached as corrective selling opportunities for longer-term players. But it’s also easy to see the pivotal nature of the 117.55-area defined by 11-Dec’s low and the market’s wavering behavior around it.
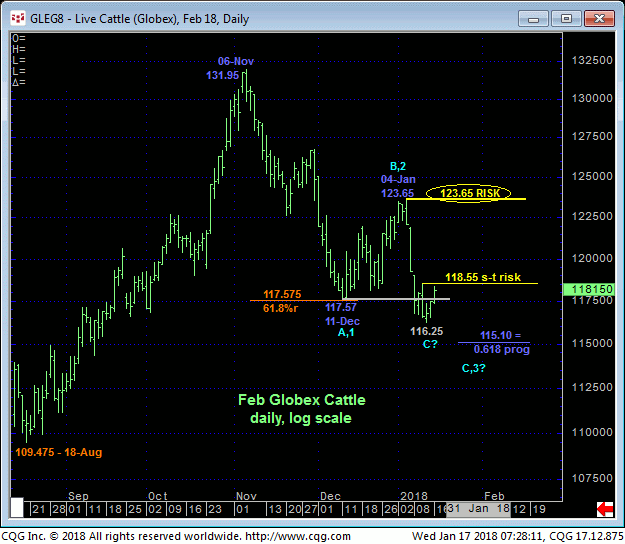
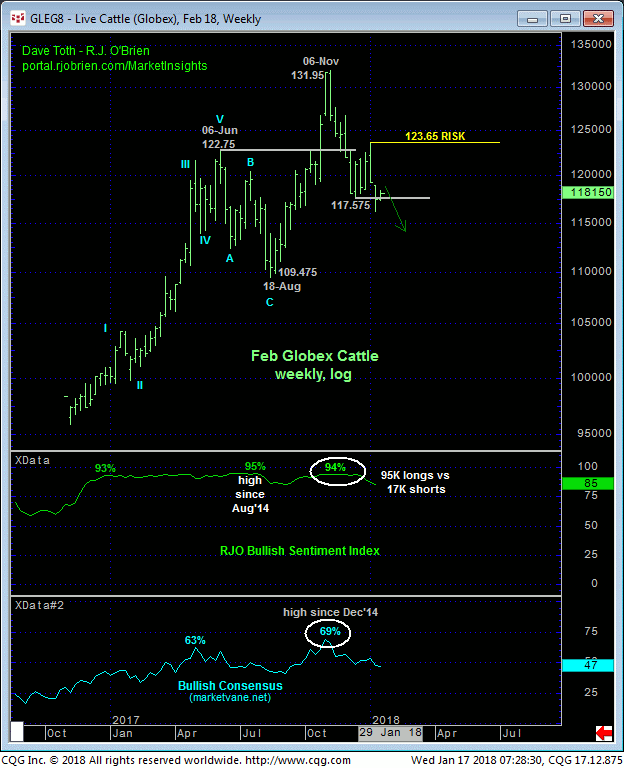
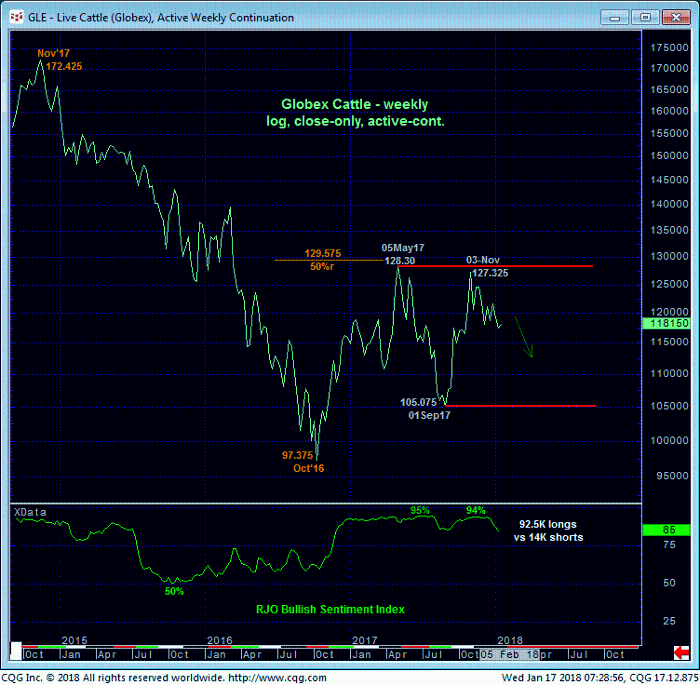
Perhaps the greatest challenge heading forward is what could be greater odds of aimless whispaw risk now that the Feb contract has returned to the middle of a range that dates back eight months while the market in general- on an active-continuation chart basis shown below- has returned to the middle-half of the past YEAR’S range. Flip a coin.
Under such range-center conditions a more conservative approach to risk assumption is preferred, and herein lies the benefits of identifying a tighter but yet objective risk parameter like 118.55. In sum, a bearish policy remains advised with a recovery above 118.55 required to warrant a move to the sidelines by shorter-term traders and for even longer-term players not will to risk short exposure to 123.65 to pare bearish exposure to more conservative levels. In lieu of such 118.55+ strength further losses should not surprise.
FEB HOGS
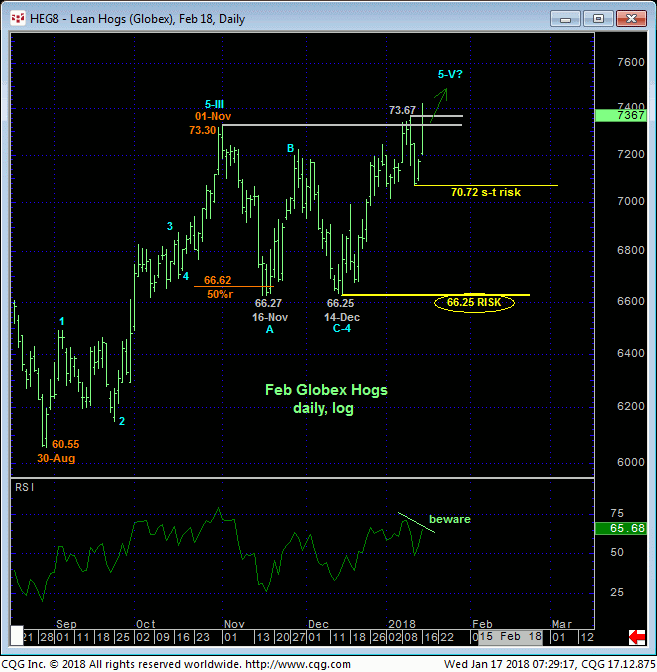
Yesterday’s poke to yet another new high leaves last Thur’s 70.72 low in its wake as the latest smaller-degree corrective low this market is now required to sustain gains above to maintain a more immediate bullish count. Its failure to do so will confirm a bearish divergence in momentum, break the uptrend and expose a larger-degree correction or reversal lower. Still-frothy bullish sentiment levels would contribute to such a peak/reversal count IF/when the market confirms the bearish divergence in mo required to render sentiment/contrary opinion an applicable technical tool.
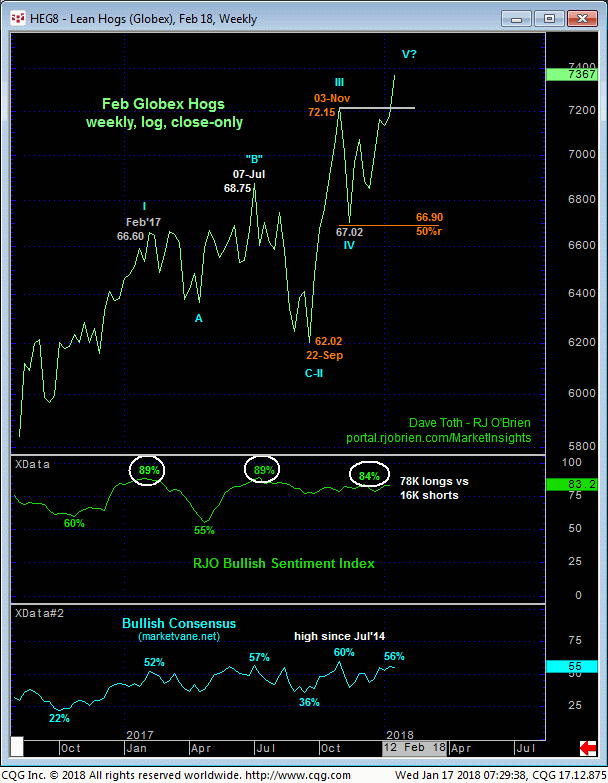
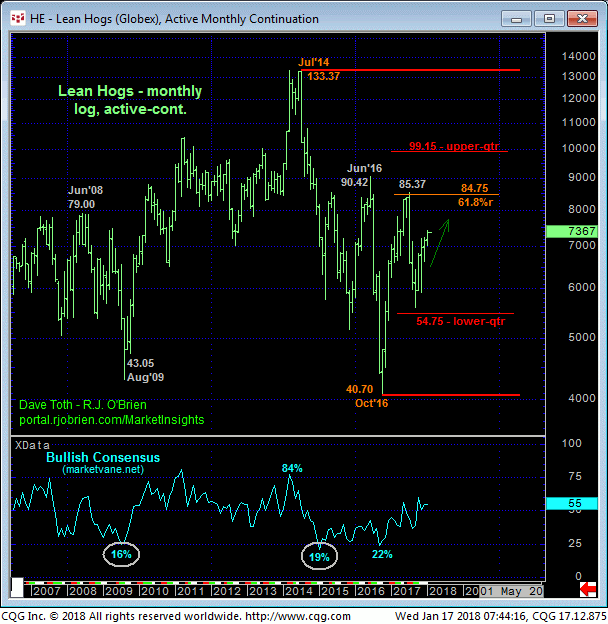
On a much broader monthly scale and per the most active futures contract however, the market remains deep within the middle-half bowels of a range that dates back three years and where continued aimless whipsaw risk must be acknowledged and prepared for. Herein lies the importance of a tight but objective risk parameter like 70.72.
In sum, a bullish policy and exposure remain advised with a failure below 70.72 required to threaten this call enough to warrant its cover and circumvent the depths unknown of a slightly larger correction or more significant reversal lower. In lieu of such sub-70.72 weakness further and possibly accelerated gains should not surprise.
