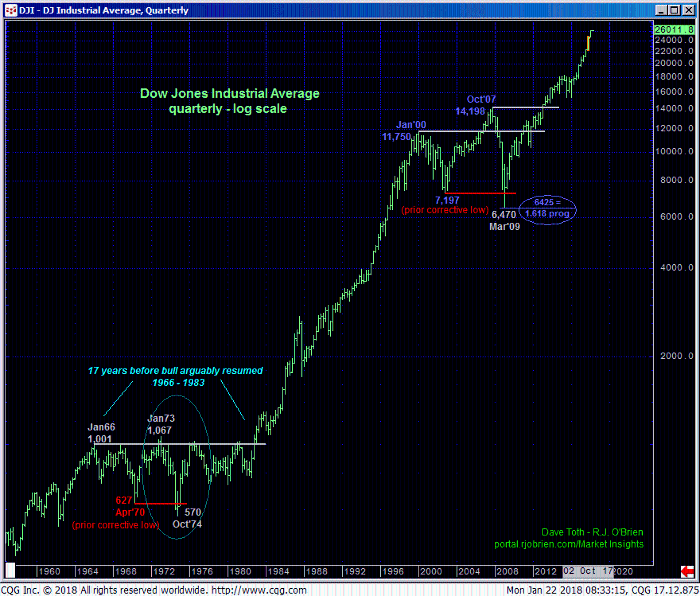
Easy to see in the 240-min chart below is the past week’s continuation of the secular bull market that leaves 16-Jan’s 2769 low in its wake as the latest smaller-degree corrective low this market is now minimally required to fail below to even defer the clear and present uptrend, let alone threaten it. But while this corrective low is of an infinitesimally small SCALE versus the magnitude of the secular advance, shorter-term traders with tighter risk profiles are nonetheless advised to use 2769 as our new shorter-term parameter from which the risk of a still-advised bullish policy can be objectively rebased and managed.
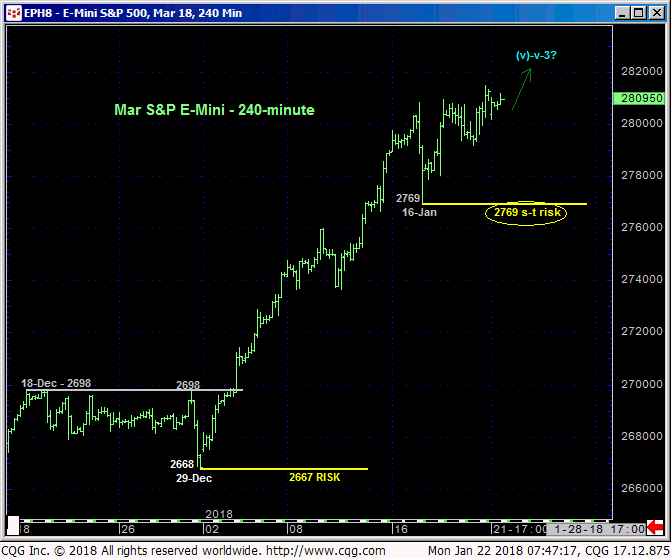
Given the extent of this month’s continuation of the secular uptrend shown in the daily log scale chart below, we are moving our “longer-term” risk parameter up to 29-Dec’s 2667 corrective low. Even though such sub-2667 weakness really wouldn’t put a dent in the secular bull, it could be enough to conclude that the portion of the bull from 21Aug17’s 2415 low is a complete 5-wave Elliott sequence that would then be prone to a slightly larger-degree correction that might best be sidestepped by all but the very longest-term players.
This chart also shows the developing POTENTIAL for a bearish divergence in the RSI measure of momentum. But as always, PROOF of weakness below at least 2769 is required to CONFIRM this signal to the point of non-bullish action like long-covers. In lieu of such proof further and possibly continued accelerated gains should not surprise.
This market’s performance over the past quarter is the latest poster child for the total irrelevance and irresponsibility of ever referring to a market as “overbought”. Traders are a reminded that all such technical “indicators” are a function of the underlying market, not the other way around, and our outside the bounds of technical discipline. A market will not go down simply because an RSI is considered “high” at some subjective level like 75% or 80%. It’s the other way around: the RSI is high because the market is rallying and strong. The derived indicator “tail” never, ever wags the underlying market “dog”.
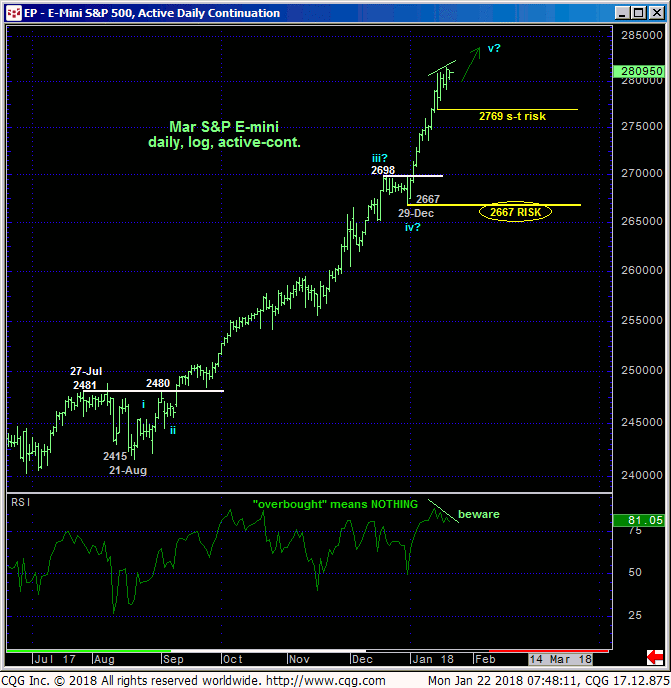
Another reinforcing element to a continued bullish assessment is the fact that the secular bull has actually been ACCELERATING for about the past nine months. Admittedly, trying to “count waves” in such an environment with so many iterative steps is a pretty futile and subjective exercise, so we’re not going to try. What we CAN do with specificity is identify corrective lows and risk parameters that the market is required to fail below to break or threaten the uptrend on various scales, acknowledging that this northbound rampaging bull has got to slow down first before any larger-degree correction or reversal is likely. Herein lies the importance of identifying corrective lows and risk parameters around which to objectively gauge this risk like 2667. Until and unless such weakness is shown, further gains remain expected with an upside potential for the bull as nebulous and potentially extensive as it was 3-, 6- or even 12-month ago.
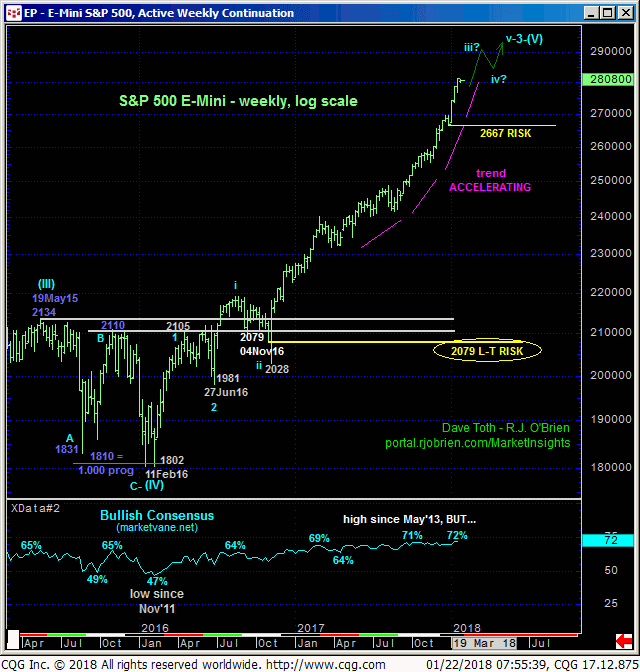
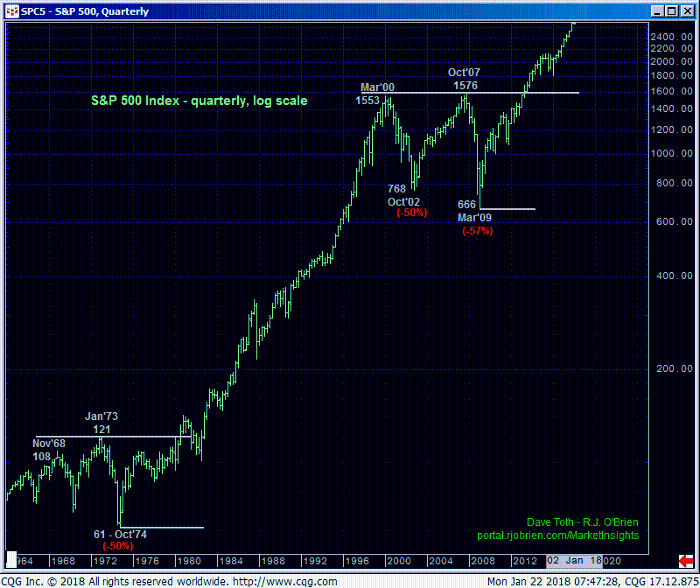
Finally, we’d like to take an even bigger step back and consider the bull’s performance from pretty much everyone’s measuring stick, Mar 2009’s 666 low shown above in the quarterly log scale chart. It’s not hard at all to find some statistic to suggest that this bull is getting long in the proverbial tooth and is ready for a correction or reversal. This begs the question about the three types of lies according to Mark Twain, “Lies, damn lies and statistics.”
It’s obviously that the latest stage of the secular advance began with Mar’09’s 666 low. And basis the DJIA below, from Mar’09’s 6470 low. Our view however is that those lows didn’t just complete a correction from Oct 2007’s highs that received all the hyperbole, but rather 9-YEAR corrections that began with their respective 1Q2000 highs as labeled. The magnitude of and “area covered by these 50%-plus corrections was nothing the U.S. equity market had seen since the late-60s-to-mid-70’s’ 50%-plus decline. The secular bull from 1942’s low until one of those highs in the late-’60s/mid-70s didn’t resume above the 1974 high until 3Q1980, and then proceeded on a 20-YEAR run that, for all intents and purposes, measured about the same length as the bull stage from 1942 until the mid-to-late-60s.
Is it possible that the resumed secular bull from 2009’s low is off on another 20-year run??? Absolutely. The current leg of the bull is about nine years old. How much is left? Nobody knows. What we DO know is that 1) the bull has ACCELERATED over the past nine months, 2) based on a preceding 9-YEAR correction there are two prior periods in which the bull rallied for 20+ years and 3) that the major but simple uptrend pattern of higher highs and higher lows has left a number of iterative corrective lows and risk parameter that the market can be required to fail below to even defer or slow down the bull, let alone threaten it.
These issues considered, a full and aggressive bullish policy remains advised with a failure below 2769 required for shorter-term traders to step aside. Commensurately larger-degree weakness below 29-Dec’s 2667 next larger-degree corrective low is minimally required for longer-term players to pare or neutralize bullish exposure. In lieu of such weakness further and possibly accelerated gains remain expected with indeterminable upside potential.
