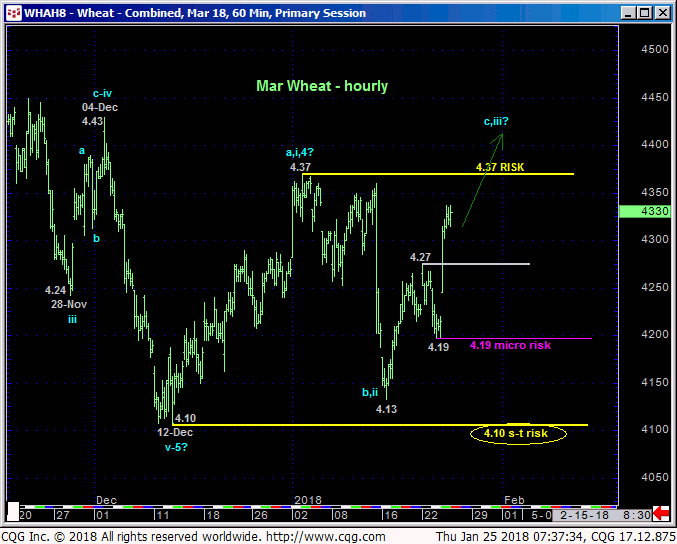
It’s been over three weeks since 03-Jan’s Technical Blog when we discussed an admittedly short-term bullish divergence in momentum that stemmed the long-term downtrend and identified some semblance of a low and support at 4.10 that we considered our new short-term risk parameter to non-bearish decisions like short-covers and cautious bullish punts. Weeks of lateral, languishing behavior thereafter provided little to alter the short-term-vs-long-term dynamics and was only a bit more exciting than watching snow melt. But now, with corn, beans and meal confirming shorter-term but nonetheless important base/reversal-threatening elements and today’s engagement of 03-Jan’s key 4.37 initial counter-trend high, we’ve reason to believe that this market may no longer be considered the Rodney Dangerfield of the grain complex.

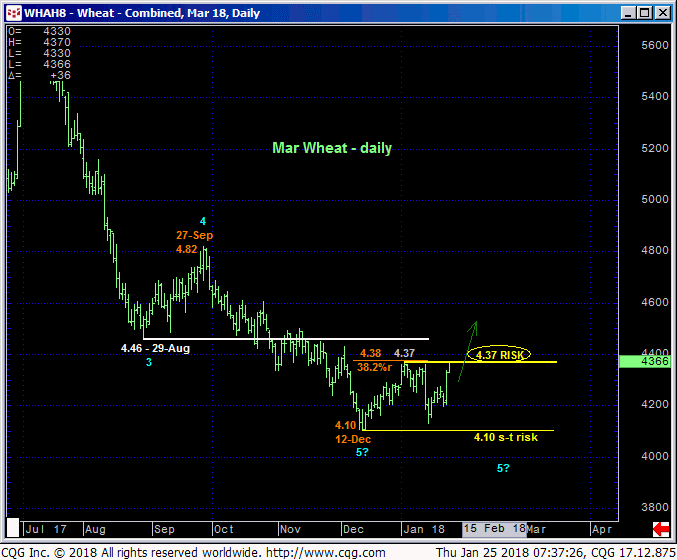
To be sure, against the backdrop of the major downtrend from last Jul’s high with a ton of former support-turned-resistance from the 4.37-to-4.46-range shown in the daily chart above, it may still be premature to conclude a broader reversal higher following a break today above 03-Jan’s 4.37 high. But we’re nonetheless considering that 4.37 level as our new long-term risk parameter, the break above which will confirm at least the intermediate-term trend as up and leave a number of corrective lows below it that can then be used as objective risk parameters from which non-bearish decisions like short-covers and cautious bullish punts can be objectively based and managed.
IF such a 4.37+ poke is “just” the c-Wave of yet another bear market correction, the market will tell us so via failures below recent corrective lows like 4.19, 4.13 and certainly 12-Dec’s 4.10 low and we can act accordingly. BUT… if such a 4.37+ poke is NOT a c-Wave but rather a 3rd-Wave, the market would be expected to rally in an increasingly trendy, impulsive manner. And using this 4.37 threshold around which to make such a bullish bet provides the one and only most optimal risk/reward level and condition around which to make this bullish call.

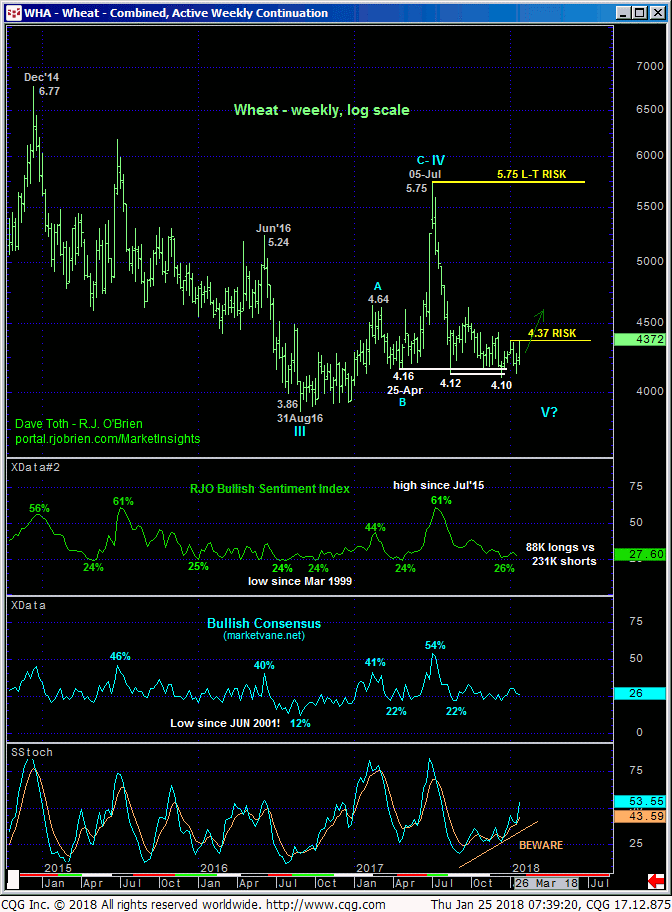
Admittedly, this market has been one of the most languishing markets across the entire commodity spectrum. The weekly log scale chart below shows understandably historically bearish sentiment, sentiment that is typical of MAJOR BASE/reversal conditions.
This long-term chart also shows downside momentum that has been waning, tiring for MONTHS. Again, a shorter-term mo failure above a level like 4.37 would preclude any CONFIRMATION of a major reversal higher. Given some of these longer-term facts however, we believe it would also be premature to conclude that such a major reversal higher is NOT unfolding on a poke above 4.37.
These issues considered, shorter-term traders remain advised to maintain a cautious bullish policy and exposure with a failure below 4.19 now required to threaten this call to warrant its cover. Further indication of strength above 4.37 should be taken as an opportunity to add to this exposure. Longer-term players are advised to neutralize al previously recommended bearish exposure on a break above 4.37 and move to a cautious bullish policy with a failure below 4.10 required to negate this call and warrant its cover. The market’s upside potential above 4.37- believe it or not- is indeterminable and potentially extensive.


