MAR T-NOTES
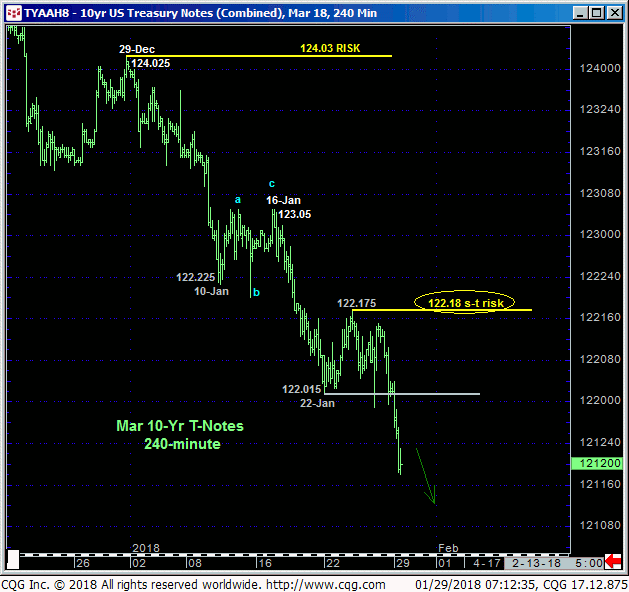
Today’s accelerated losses and more decisive break of the lower-122-handle obviously reaffirms the major bear trend and leaves 24-Jan’s 122.175 high in its wake as the latest smaller-degree corrective high this market is now minimally required to recoup to even defer, let alone threaten the bear. Per such we are marking 122.18 as our new short-term risk parameter to a still-advised bearish policy and exposure.
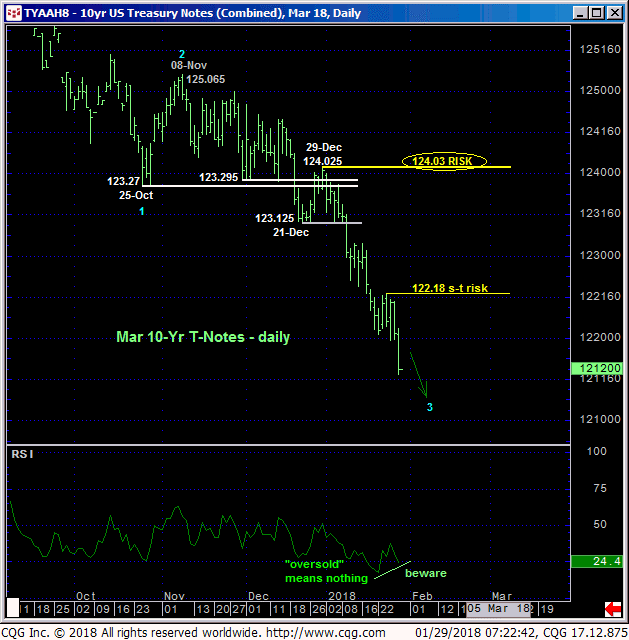
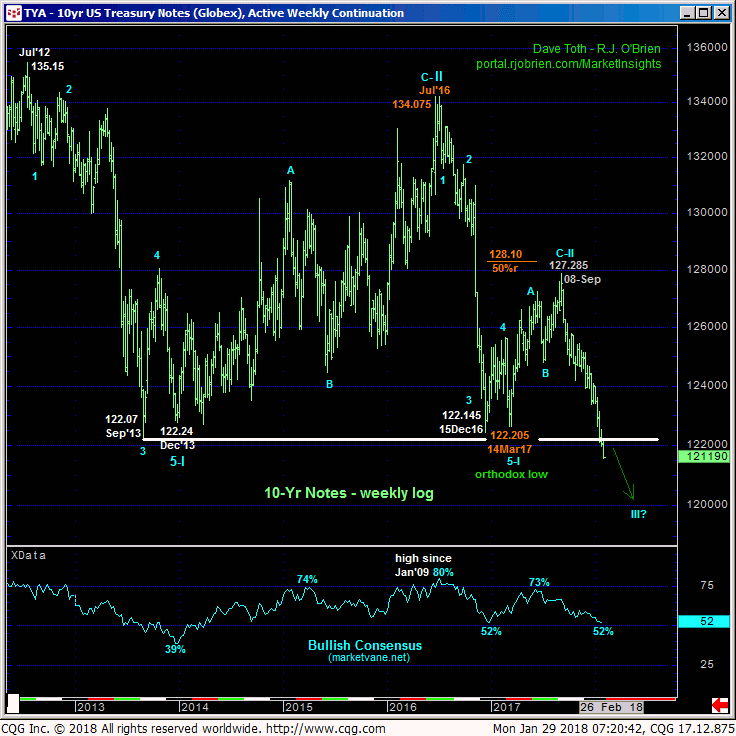
The daily chart above shows the POTENTIAL for a bullish divergence in the RSI measure of momentum, but only proof of “non-weakness” above 122.18 will CONFIRM the divergence to the point of non-bearish action like short-covers. In lieu of such 122.18+ strength the trend is down on all scales and should not surprise by its continuance or acceleration, especially given that the past couple week’s portion of the bear has broken the past FOUR YEARS’ support around the 122-1/4-area shown in the weekly chart below.
In effect, there is no support as the only levels below the market are “derived” from previous data points. And such derived levels never have proven to be reliable reason to identify support without an accompanying bullish (in this case) divergence in momentum. And they never will. Virtually all technical levels of merit currently reside only ABOVE the market in the form of former 122.02-area support-turned-resistance and prior corrective highs like 122.18. Until and unless such strength is shown, further and possibly extensive losses remain expected straight away with indeterminable downside potential.
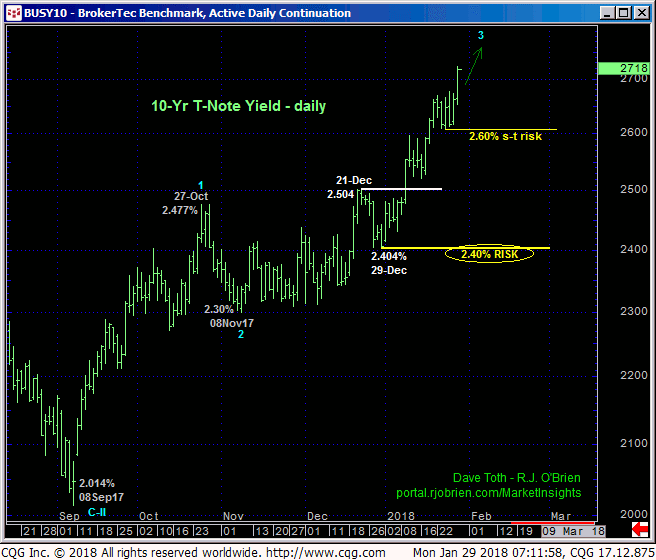
From a 10-yr yield perspective 24-Jan’s 2.605 corrective low serves as our new short-term risk parameter to a count calling for further and possibly steep, accelerated yield gains as traders are reminded of our very long-term count that contends the Treasury market is in a new secular bear that could produce higher yields for a generation.
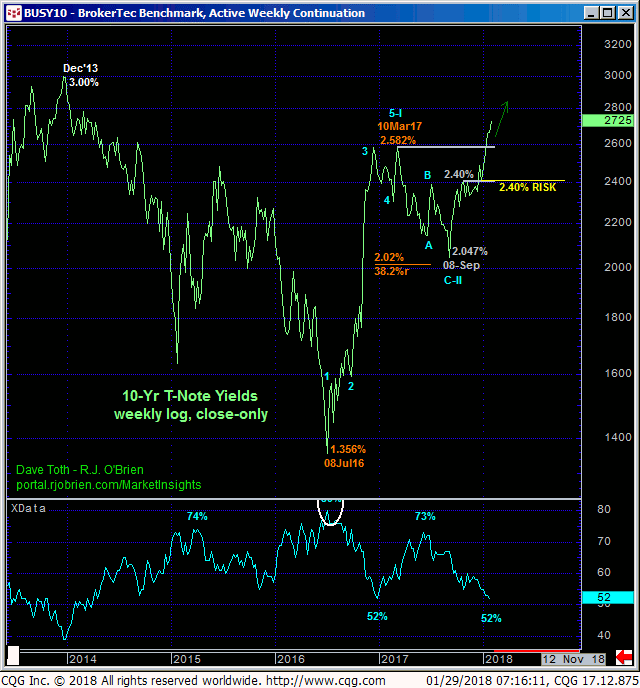
As a result of the past couple weeks’ breakout above 2017’s 2.58% high and new high rate for the what we believe is a new secular uptrend in rates from Jul’16’s 1.35% low, the weekly log close-only chart below shows that the market has exposed an area totally devoid of any technical levels of merit shy of Dec’13’s 3.00% high. This doesn’t mean we’re forecasting a move to 3.00%. But it certainly does mean that until and unless rates weaken below at least 2.60%, a run at and potentially well above 3.00% is as plausible as any other call.
In sum, a bearish policy remains advised with strength above at least 122.18 required to even defer, let alone threaten the bear and warrant defensive measures commensurate with one’s personal risk profile. In lieu of such strength further and possibly accelerated losses remain expected straight away with former 122.02-area support considered new near-term resistance.
DEC18 EURODOLLARS
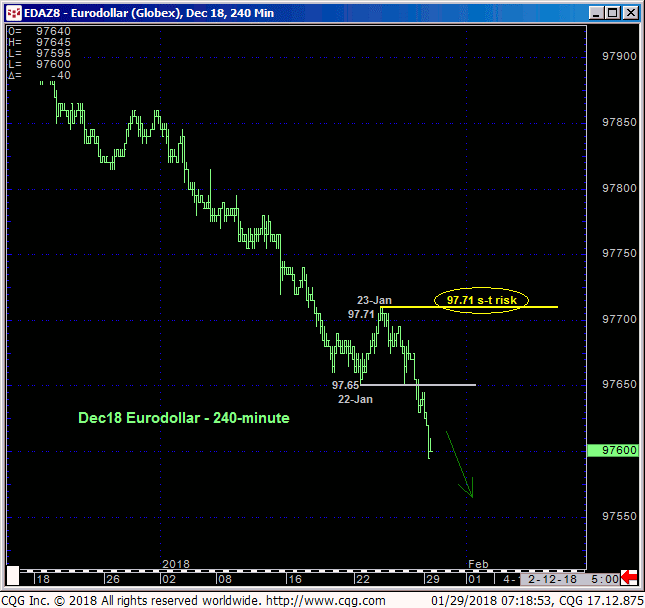
Quite simply, the trend is down on all scales and is fully expected to continue and possibly accelerate. Fri and today’s break below 22-Jan’s 97.65 low reaffirms the major downtrend and leaves 23-Jan’s 97.71 high in its wake as the latest smaller-degree corrective high and new short-term risk parameter this market is now minimally required to recoup to even defer, let alone threaten the bear.
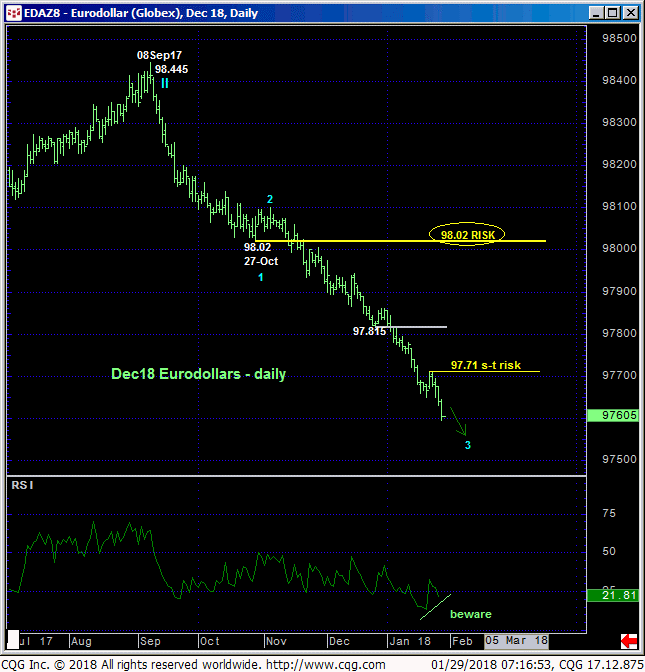
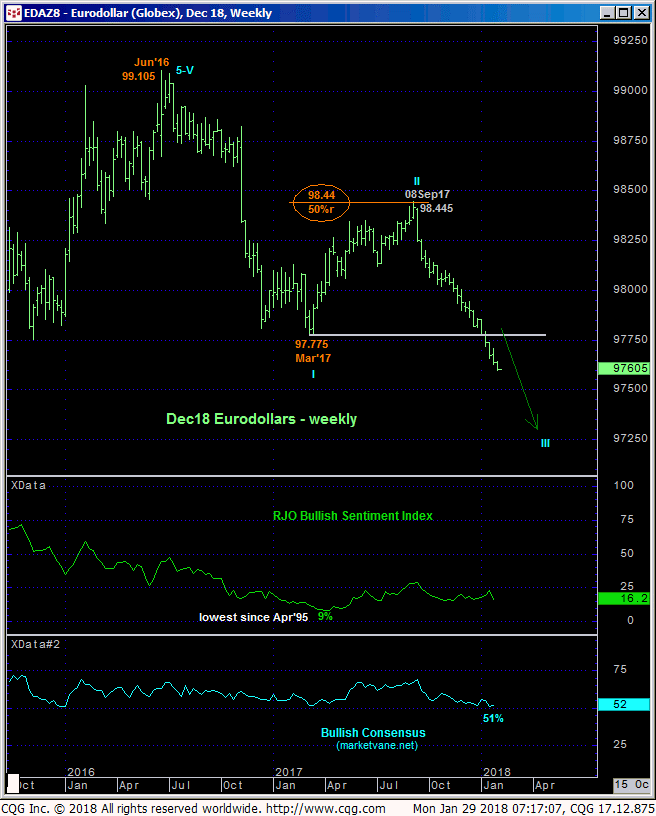
The weekly (above) and monthly (below) charts show the magnitude of this month’s break below Mar’17’s 97.77 low that reinstates what we believe is a new secular bear market. Basis just the Dec18 contract, the monthly chart below shows this month’s resumption of a developing bear trend from Jun’16’s 99.10 high that requires a recovery above at least Sep’s 98.45 corrective high and exact 50% retrace of 2016-17’s 99.10 – 97.77 decline to negate a long-term bearish count.
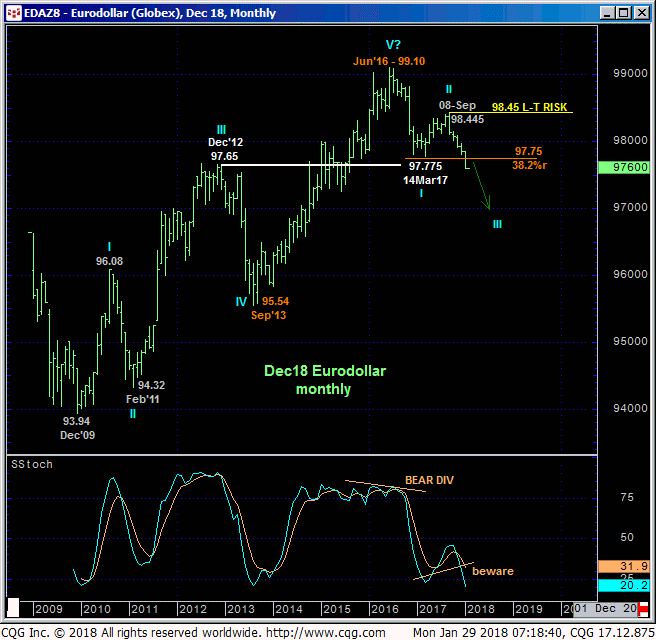
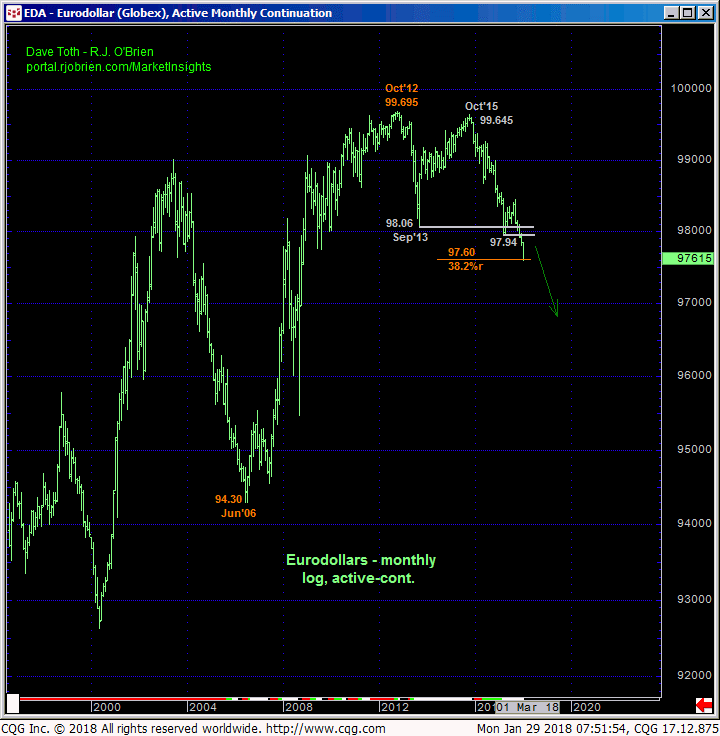
On a monthly log scale basis of the most active futures contract, the past couple months’ resumed slide arguably reinstates a major reversal of the entire rally from at least 2006’s 94.340 low and may, as we contend, be reversing the past generation’s bull market. If this ultra-bearish count is correct, the past couple months’ resumption of this downtrend should not only continued to produce losses, but produce them in an accelerated, even relentless manner.
In sum, a full and aggressive bearish policy and exposure remain advised with strength minimally above 97.71 required to even defer, let alone threaten this call and warrant some defensive measures. In lieu of such 97.71+ strength further and possibly accelerated losses remain expected straight away.
