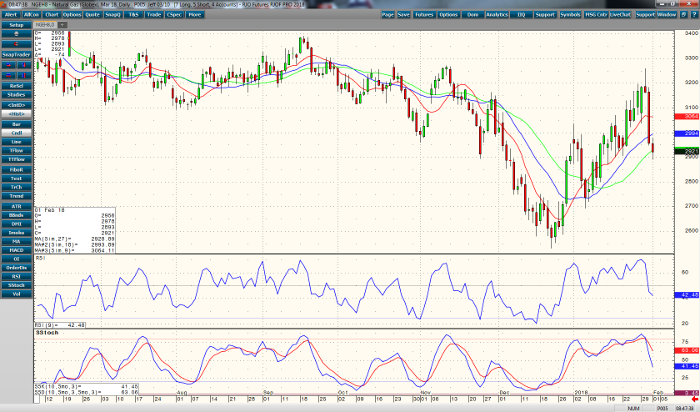
Until yesterday the trend in natural gas was up. Yesterday’s 234 point range down has turned the tide once again. The trend in the market is now clearly down. In the six days prior, the prices increased from 2.944 to a high of 3.259. A large draw of -288 bcf last week was met with lukewarm price gains. This week’s draw is expected to be right around -102 bcf. It seems to me that the market is anticipating the storage number and trading it a few days prior. I think we may see a smaller draw than expected, but that was part of yesterday’s sell-off. Momentum studies are down, and should help falling price action. Support around 2.900 may hold beneath that with 2.700 as the next level down on a daily chart. Yesterday’s close above 2.900 might stem further sell-offs. A close above January 18’s 3.070 is needed to turn the trend up again.
Milder weather is predicted for the coming week. Although storage numbers are below the five year averages, production seems to be increasing. Any bullish news doesn’t seem to be influencing traders yet. Expect a slide between 2.900 and 2.850.
Natural Gas Mar ’18 Daily Chart


