While a 1-week, 12% move in ANY market is certainly nothing to sneeze at, within the context of the secular bull market that posted an all-time high only a week ago we will identify the technical factors below that we believe will show this decline to be not a “meltdown” but rather a corrective “hiccup” and golden opportunity for bulls who have might not have gotten long enough at more optimum risk/reward levels following Dec’16’s post-election breakout.
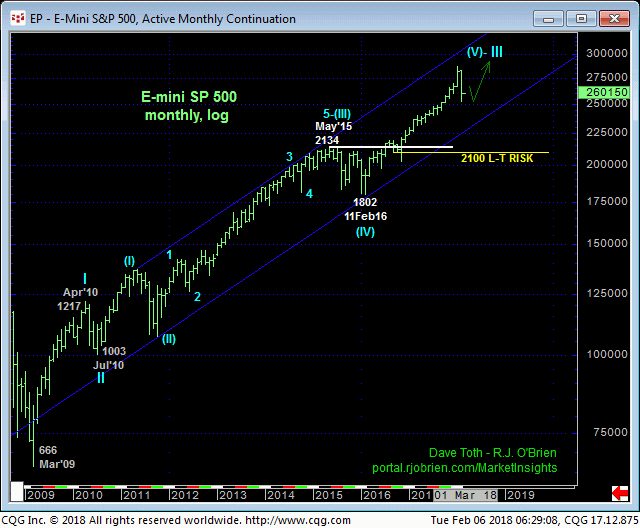
Beginning with a historical perspective, the monthly log scale chart below shows the magnitude of the secular bull market. Over the last eight years that followed a 9-year, 57% correction (Mar 2000 to Mar 2009) that stands as one of only three MAJOR corrections dating back to the 1932 Great Depression low, the resumed secular bull market is riddled with relatively small corrections such as the past week’s spasm. On this scale it would be grossly premature at this juncture to conclude that the past week’s decline is anything but another buying opportunity in a long list of corrective hiccups.
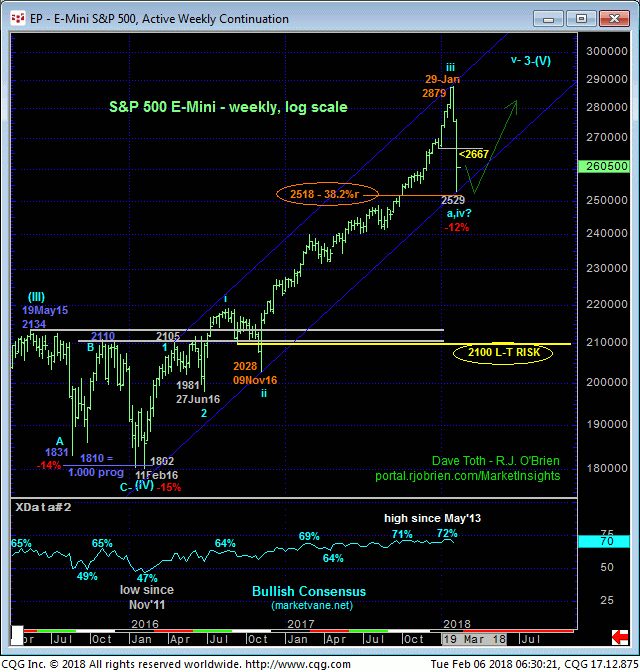
Even on a weekly log scale basis below, the past week’s setback has thus far stalled within spittin’ distance of a Fibonacci MINIMUM 38.2% retrace of just the portion of the secular bull from 09Nov16’s infamous, Trump-upset low of 2028. If the 2529-area holds, it would seem to reinforce the wave count that suggests the past week’s decline is just a corrective 4th-Wave within a 50wave sequence up from Jun’16’s 1981 low. A run to new highs above 2879 would then be expected to complete that sequence.
In 02-Feb’s Technical Blog we discussed the market’s vulnerability to a short-term correction following a bearish divergence in short-term momentum below 2818 that allowed for an objective cover of bullish exposure by shorter-term traders and even a cautious bearish opportunity. Historically frothy bullish sentiment contribute to downside vulnerability. Given the extent of the collapse that followed, we strongly suspect that that “pressure relief valve” has been tripped and that the market has returned to a more even keel from a market sentiment/contrary opinion perspective. This week’s Bullish Consensus/marketvane.net data will be updated tonight.
This market sentiment/contrary opinion issue contributes to the silver lining. It’s s been our observation over decades of technical research that when an INITIAL counter-trend move is as OBVIOUS as this one has been- RIGHT OUT OF THE GATE and with all of the media hyperbole and investor fear and fearful reaction that stems from such an event- that move proves to be either a complete correction ahead of a resumption of the dominant trend or is AT LEAST vulnerable to an extensive (i.e. 61.8% retrace or greater) corrective rebuttal within the context of a much broader consolidation range.
Considered another way, if the market has a lot more bear ahead of it, it would be highly unusual for the bear to scare everyone out in a more obvious way “early” in the process and then to REWARD that action with still further losses.
The weekly chart below also shows the last more protracted correction from May’15’s 2134 high to Feb’16’s 1802 low. This multi-month consolidation range included two mirror-image 14% declines that comprised an overall 15% correction before the secular bull resumed and produced nothing short of fantastic gains. In one fell swoop the current market has dropped 12%. Combined with the market thus far holding the exact 38.2% retrace of Nov’16 – Jan’18’s 2028 – 2879 portion of the bull AND the lower boundary of the major up-channel, we believe this 2529-“area” to be a fertile one around which to beware a bullish divergence in momentum needed to stem the slide and expose a potentially extensive corrective rebuttal or resumption of the secular bull.
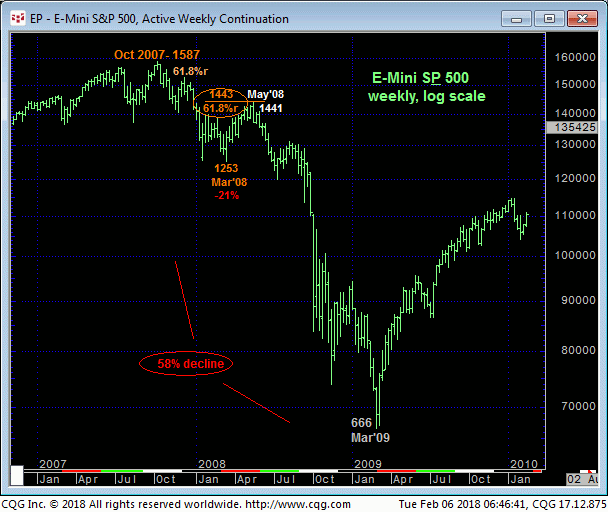
Let’s take the 2007 – 2009 major bear market shown in the weekly log scale chart below as an example. We all know what happened, with fundamental rationale for the meltdown not truly surfacing until late-summer/early-fall of 2008, arguably 10 MONTHS after Oct’07’s 1587 peak. The initial sell-offs in Oct-Nov’07 and then Oct’07 to Mar’08 were BOTH retraced by 61.8% corrections or greater before the bottom fell out. Additionally, the slowdown process typical of such major peak/reversal environments included waning upside momentum starting as early as Mar’07.
The current environment has NONE of these factors that typify virtually all major market turning points. And per such we believe that the past week’s spasm is either nearing the END of a bull market correction and offering a tremendous risk/reward buying opportunity OR nearing the end of the first phase of a multi-month consolidation between 29-Jan’s 2879 high and the approximate 2529-area and is vulnerable to a potentially extensive (i.e. >61.8% retrace, B-Wave) corrective rebound within this range. This latter count also would present a terrific risk/reward buying opportunity in the weeks ahead.
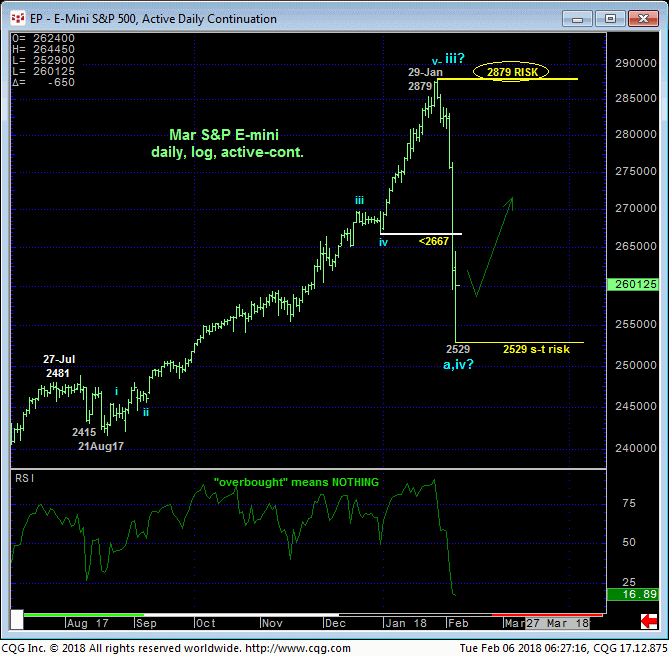
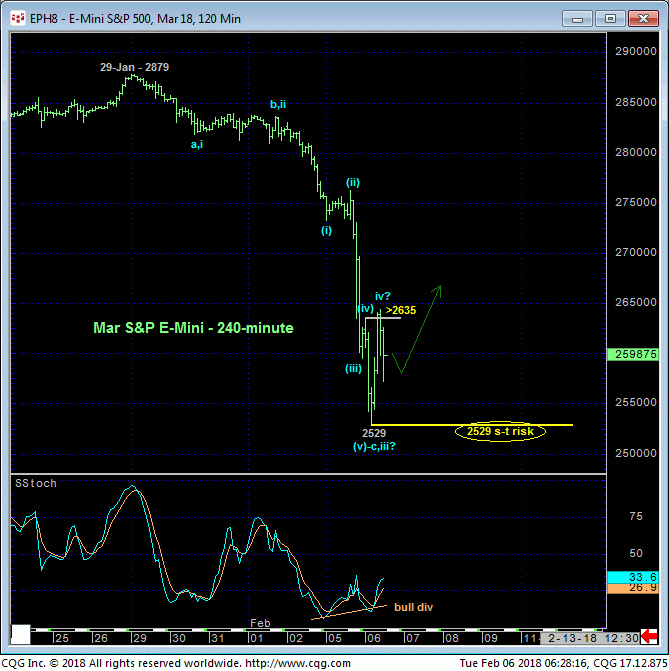
The near-term challenge is one of negotiating the end of the clear and present downtrend shown in the daily log chart above and 120-min chart below. And the technical tool used for navigating trend changes in MOMENTUM. Overnight’s recovery above a very minor corrective high at 2635 from yesterday afternoon confirms a bullish divergence in short-term momentum that identifies yesterday’s 2529 low as one of developing importance and possibly the end of a wave sequence down from 29-Jan’s 2879 high. As a result, yesterday’s 2529 low serves as a very tight but effective risk parameter from which non-bearish decisions like short-covers and cautious bullish punts can be objective based and managed.
Overnight’s “pop” could also just be an interim (4th-wave) correction ahead of resumed losses, and a relapse below 2529 will confirm this count. Given the past week’s collapse, it’s resumption should come as no surprise to anyone. But at least the market has identified a level around which decisions can be considered objective.
If the bullish divergence in short-term mo is signalling a recovery, the next bit of reinforcing evidence will come from the market’s recovery above overnight’s 2645 high, providing another opportunity to add to cautious bullish punts with protective sell-stops below 2529.
In sum, we believe the past week’s collapse to be either a complete or nearly complete correction ahead of the secular bull’s resumption OR the initial (A-Wave phase of a multi-month consolidation between 29-Jan’s 2879 high and the approximate 2500-area before the secular bull’s resumption later this year. Per such we advise watching closely in the days and perhaps even hours immediately ahead for the bullish divergence in momentum needed to stem the decline and present what we believe will be a very favorable risk/reward opportunity from the bull side. A relapse below 2529 will reinstate the slide, of course, expose further, indeterminable losses.