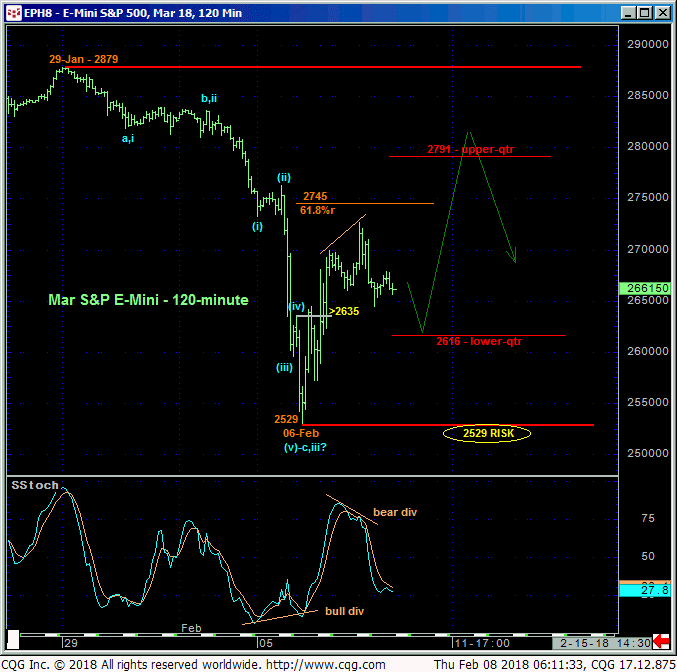
In Tue’s Technical Blog we discussed the bullish divergence in very short-term momentum above 2635 that warned of a pending bottom to the recent swoon. The 240-min chart shows subsequent recovery that reinforces Tue’s 2529 low as the END to the decline from 29-Jan’s 2879 high. What’s far from conclusive- and may be so for weeks or even longer- is whether that 2529 low completed the entire correction within the secular bull or just its initial stage ahead of further consolidation.
The good news is that the market has specified a very reliable low and support at 2529 that, for the time being at least, defines the lower boundary of a range between that low and 29-Jan’s 2879 high. The bad news is that the market went from an easy trending market to a consolidative range market. And ranges are where trend-followers go to die.
Worse, the 240-min chart shows the market’s current position in the middle-half of this range where we always approach the odds of aimless whipsaw risk as higher. Trading’s tough enough to begin with, but the middle-half bowels of a range present a coin-flip environment that at least calls for a much more conservative approach to risk assumption and, at best, should simply be simply avoided as an area and condition from which to initiate directional exposure.
Rather, we advise traders to take the trading range approach of waiting for a bullish divergence in short-term momentum from the range’s lower-quarter for a cautious scalp from the buy side and a countering bearish divergence in short-term mo from its upper-quarter to take a more accommodating risk/reward punt from the bear side.
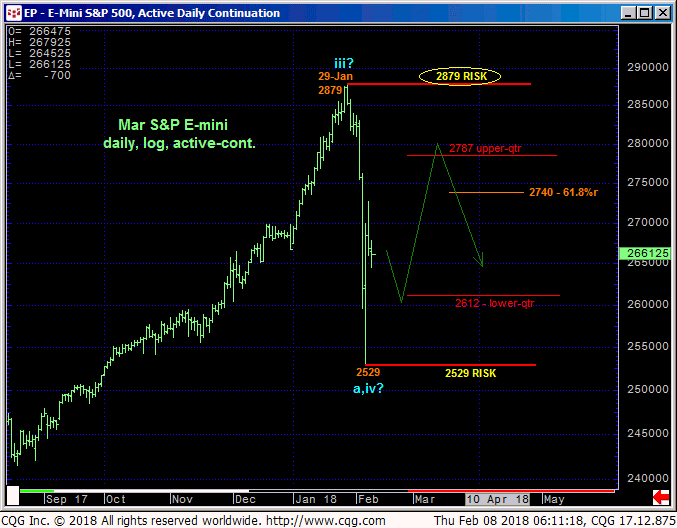
The daily log scale chart above shows the 2787-to-2612-middle-half range within the broader 2879 – 2529-range. Traders are encouraged to avoid initiating directional exposure from within this middle-half range where the risk/reward merits of doing so are poor. Especially against the backdrop of the secular uptrend, a bullish divergence in short-term momentum on a run at the 2600-area would present a favorable risk/reward buying opportunity. Conversely, a bearish divergence in short-term mo from a run up at the 2800-area would be advised to be met with the same discipline and a favorable risk/reward opportunity from the bear side.
Given the magnitude of the secular bear and relatively MINOR relapse the past couple weeks, there is ABSOLUTELY NO technical evidence thus far that would objectively justify concluding the secular bull market is over. NONE. As the uptrend has obviously stalled and if a reversal pattern is ruled out for the time being, that leaves a consolidation pattern as the only remaining technical possibility. And until 29-Jan’s 2879 high and one of our key risk parameters is broken, further intra-2879-to-2529-range consolidation is expected. A break below Tue’s 2529 low and the other of our key risk parameters is required to expose a more downwardly-skewed correction or raise the odds of a more extensive reversal lower.
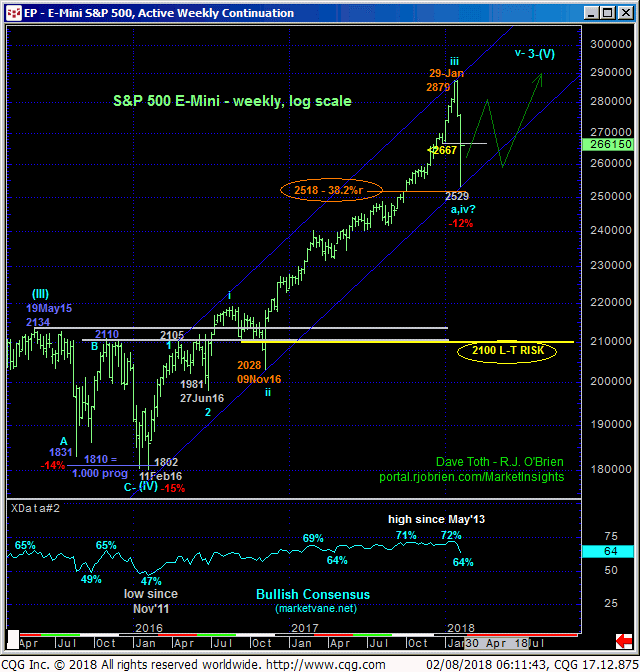
The weekly log chart below shows the magnitude of the secular uptrend and the thus far Fibonacci MINIMUM 38.2% retracement of just the portion of the bull from 09Nov16’s 2028 low to 29-Jan’s 2879 high. The fact that this week’s collapse held the derived lower boundary of the past TWO YEARS’ up-channel looks cool and MAY prove very important, but for the time being we’re taking this bullish-inferred fact with a grain of salt.
There’s no way to tell at what would be this very early juncture if the recent setback is just the (a-Wave) start to a more prolonged- in terms of TIME- consolidation like that that unfolded from May’15’s 2134 high to Feb’16’s 1802 low shown below. However, a bearish punt following a bearish divergence in momentum from the recent range’s upper quarter would position even longer-term players for whatever might unfold to the downside thereafter; either a “mere” return to the lower-quarter of the range or perhaps even a break below Tue’s obviously key 2529 low.
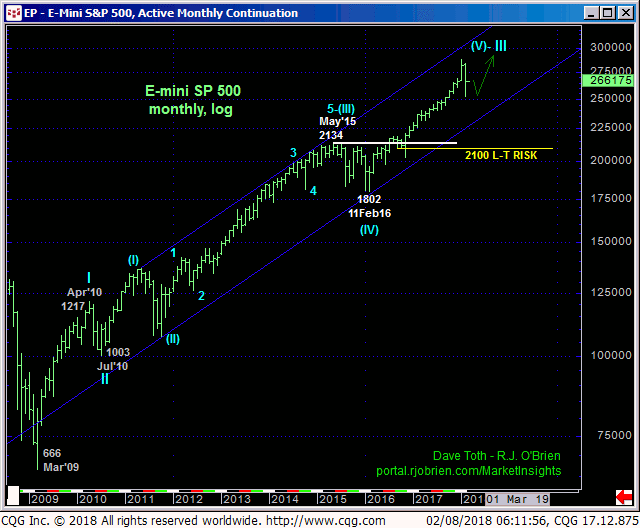
In sum, we advise traders to move to a trading-range approach and look for a bullish divergence in short-term momentum from the approximate 2600-area or below to take a bullish position and, conversely, wait for a bearish divergence in short-term mo from the 2800-area OB to take a punt from the bear side. We also urge traders to avoid initiating directional exposure between 2600 and 2800 that defines the middle-half of the past couple weeks’ range where the risk/reward merits are poor. A break below 2529 is required to expose a greater downside threat while a recovery above 2879 will obviously reinstate the secular bull.
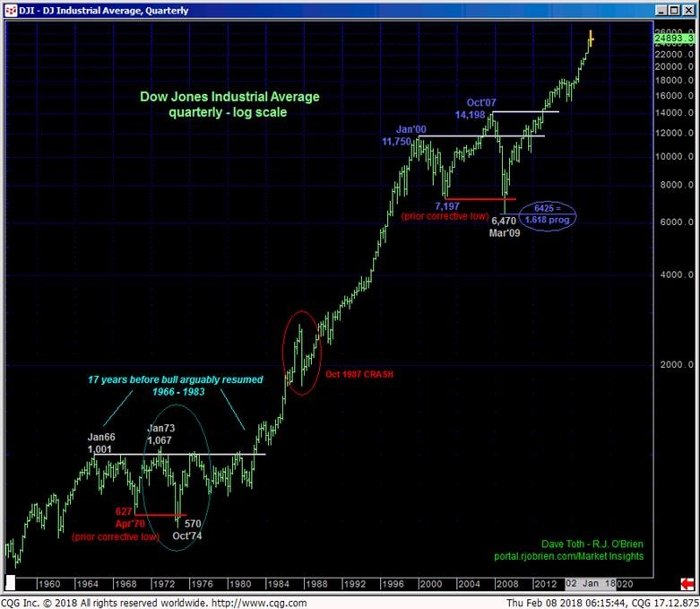
Finally, in 22-Jan’s Technical Blog we discussed why we believe the resumed secular bull market from Mar 2009’s low (6,470 in the quarterly log scale chart of the DJIA below) has YEARS to run, perhaps 10 years! This call is based on the premise that Mar 2009’s low didn’t complete a mere 17-month spasm from Oct’07’s 14,198 high, but rather a huge NINE YEAR correction from Jan 2000’s 11,750 high that qualified it as one of the three major, multi-year corrections the U.S. equity market incurred since the Great Depression low of 1932. The previous corrective “event” of similar character unfolded from Jan 1966 to at least Oct 1974 and arguably until 1982 before taking off on a near-20-YEAR bull explosion.
About roughly a third of the way into this ride the market experienced the Oct 1987 CRASH. At the time, and after just a few years of the S&P futures contract, this “crash” was a world-threatening event to live through. Yet, in hindsight and given the “obviousness” of this event that washed most bulls out, it proved extraordinarily short-lived and set the stage for an absolutely huge run that defied economists and sages for years to come. The recent 12% hiccup doesn’t even register thus far.
IF the market relapses below 2529, we can certainly take that specific event to position from the bear side for whatever the market might have in store for us thereafter. When the market recovers above 2879 however, there is no way to know that that move won’t span years and once again defy the experts.
