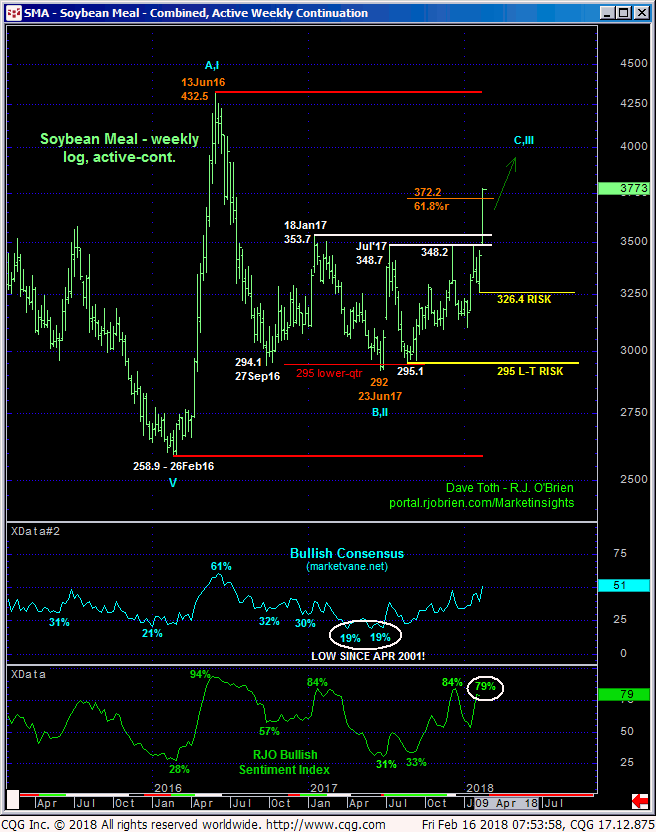
This week’s obliteration of the 348-to-353-range that has capped this market as resistance for the past YEAR reinforces our very long-term bullish count introduced more than seven months ago in 03Jul17’s Technical Blog following an impressive bullish divergence in momentum amidst historically bearish sentiment that warned that Jun’17’s 292 low completed a major correction from Jun’16’s 432 high and exposed a resumption of early-2016’s uptrend that preceded it. The extent and impulsiveness of this week’s rally reinforces this bullish count and exposes run at and (we believe) through Jun’16’s 432 high and leaves this huge and now former 350-area resistance as an equally huge new support candidate ahead of further and possibly extensive gains.
This weekly chart also shows NO levels of any technical merit between spot and Jun’16’s 432 high that can be acknowledged as a resistance candidate. The ONLY levels between spot and Jun’16’s 432 high are levels “derived” from previous data points. And traders are reminded that such merely derived levels like Bollinger Bands, Imokus, channel lines, the ever-useless moving averages and even the vaunted Fibonacci relationships we cite often never have proven to be reliable reasons to expect resistance (or support) without an accompanying bearish divergence in momentum. And they never will.
The only levels of any technical pertinent currently as a result of this week’s bust out are former resistance-turned-support like the 350-area and prior corrective lows we’ll specify below.

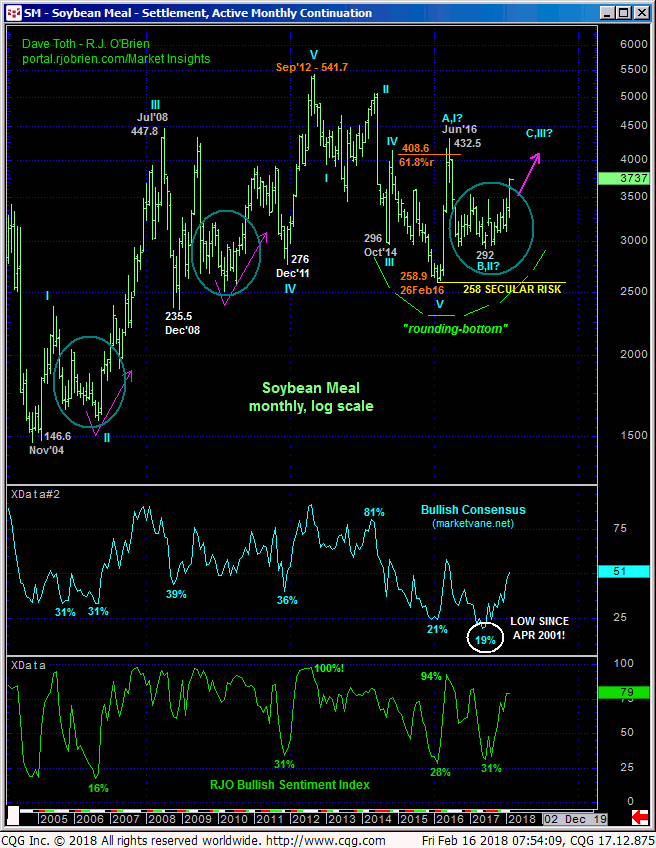
The monthly log scale chart below shows this month’s confirmation of the major, multi-year base/reversal environment similar to those that followed the Dec’08 and Nov’04 lows circled in blue. Further long-term gains are expected as a result with a failure below 05-Feb’s 326.4 larger-degree corrective low minimally required to threaten this call.


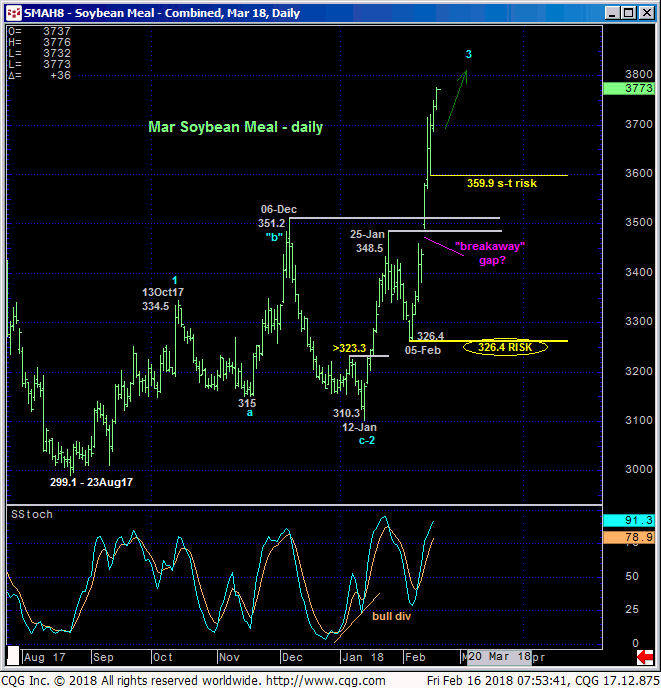
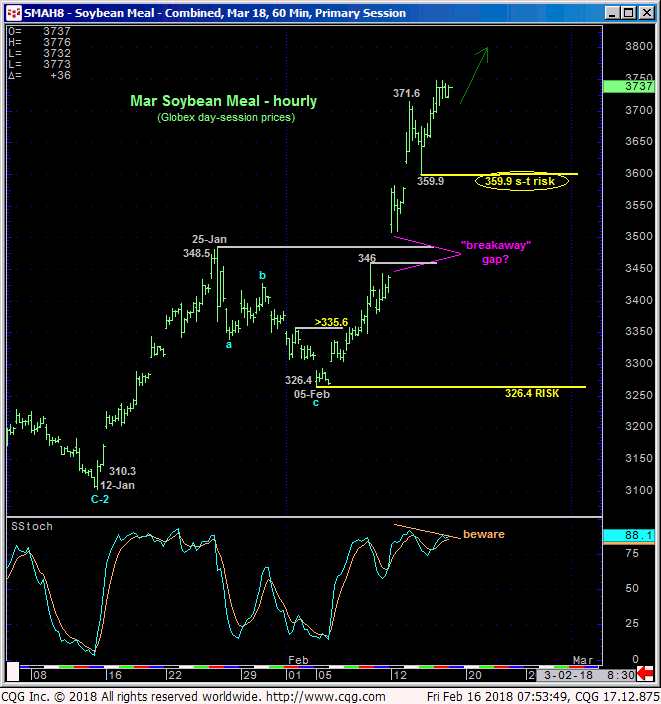
The daily chart above and hourly chart below detail the current uptrend from 12-Jan’s 310.3 low following 17-Jan’s bullish divergence in momentum discussed in that day’s Technical Webcast. “Breakaway gaps” characterize a very strong, 3rd-wave-type rally in which further, extensive gains remain expected. Perhaps most importantly, these charts also recent smaller- and larger-degree corrective lows at 359.9 and 326.4 that the market is now required to fail below to defer or threaten a bullish count. In this regard these levels now serve as our new short- and longer-term parameters from which the risk of a still-advised bullish policy and exposure can be objectively rebased and managed.
In sum, a full and aggressive bullish policy and exposure remain advised with a failure below 359.9 required for shorter-term traders to take defensive action and commensurately larger-degree weakness below 326 for long-term players to do the same. In lieu of such weakness we anticipate further and possibly accelerated gains to and eventually through Jun’16’s 432 high.


