MAY SOYBEANS
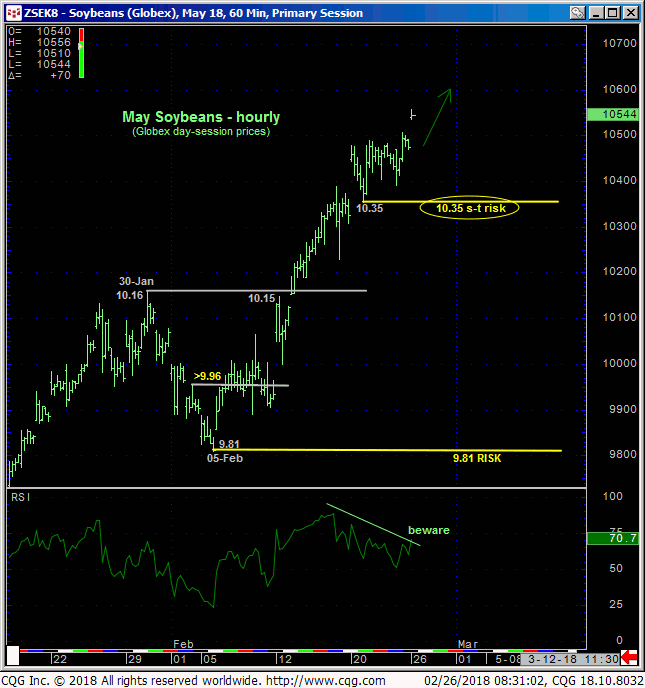
Fri and overnight’s gains above recent 10.49-area resistance reaffirms the developing uptrend and leaves 20-Feb’s 10.35 low in its wake in the now-prompt May contract as the latest smaller-degree corrective low the market is now minimally required to fail below to defer or threaten our bullish count. In this regard that 10.35 low serves as our new short-term risk parameter from which a still-advised bullish policy and exposure can be objectively rebased and managed.
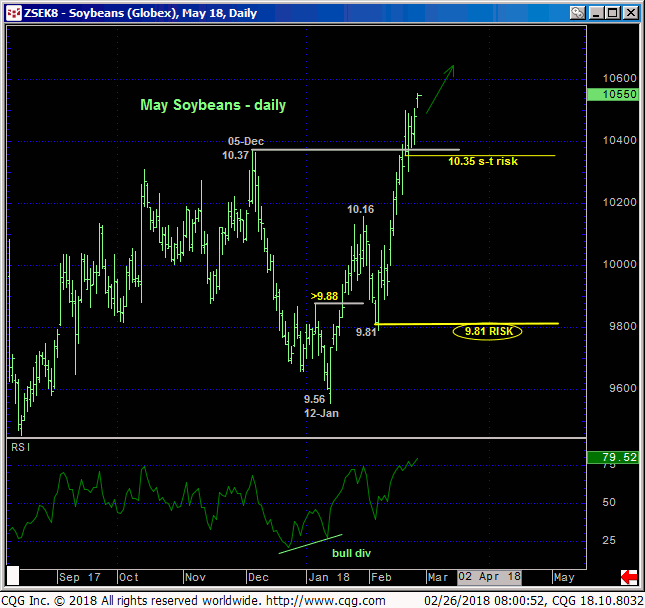
The daily chart above shows last week’s break above 05-Dec’s 10.37 high and now-former resistance that we’d expect to hold as new support per any broader bullish count. But the market’s encroachment on the upper-recesses of the past year’s lateral range and middle-half of the past 3-YEAR range cannot be ignored as a key resistance candidate that could once again repel the bull like it did last summer and in Jan’17. Herein lies the importance of even tight risk parameters like 10.35.
The weekly log active-continuation chart below also shows the past few weeks’ return to historically frothy levels in our RJO Bullish Sentiment Index of the hot Managed Money positions reportable to the CFTC. But we would remind traders that sentiment is not an applicable technical tool in the absence of a confirmed bearish divergence in momentum needed to stem the clear and present uptrend. Indeed, the current 83% reading may be similar to Apr’16’s rally that quickly generated an 86% reading by the time the market rallied to the 10.30-area, but still had nearly $2.00 of rally yet ahead. This is exactly why any “overbought” (or “oversold”) references are totally useless and irresponsible. If an analyst or broker tells you a market is “overbought”, hang up the phone!
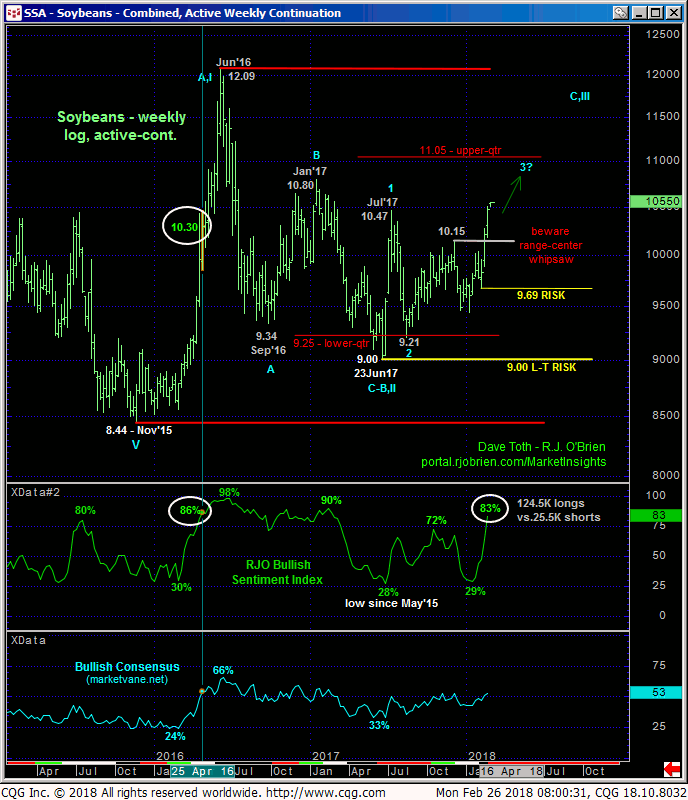
We’ve advocated a major base/reversal/bullish policy from the lower-quarter of the 3-year range since Apr’16. Whether the current rally is THE rally that drives bean prices to 12.00+ levels remains to be seen. But until and unless this market confirms a bearish divergence in momentum needed to even defer the clear and present uptrend, there is no way to know at this juncture that this rally isn;t THAT rally.
In sum, a full and aggressive bullish policy and exposure remain advised with a failure below 10.35 required for shorter-term traders to step aside and circumvent the depths unknown of what we’d suspect is another interim corrective dip within the broader bull. Longer-term players are advised to maintain a bullish policy with commensurately larger-degree weakness below at least late-Jan’s 10.16-area resistance-turned-support. In lieu of such weakness further and possibly accelerated gains remain expected with indeterminable upside potential.
MAY SOYBEAN MEAL
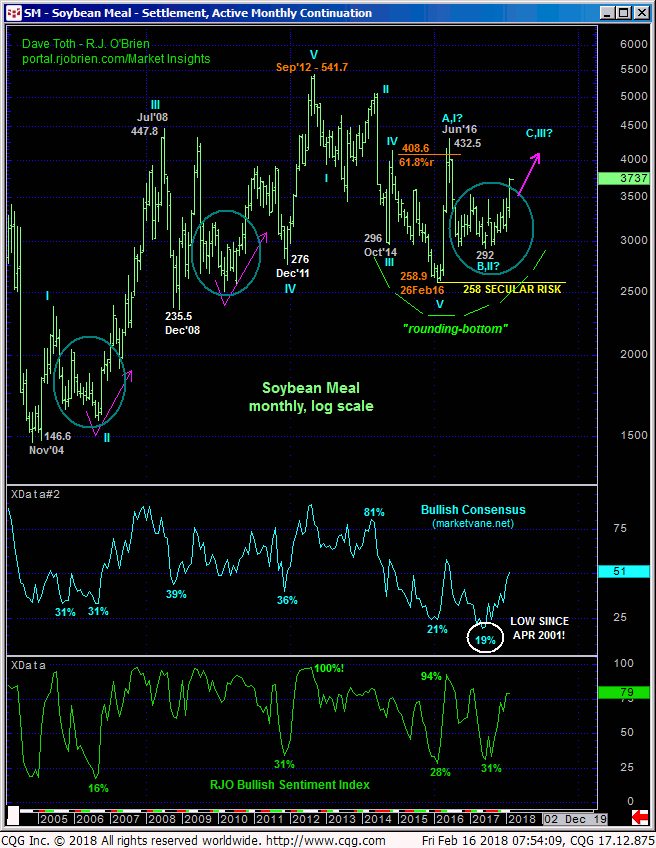
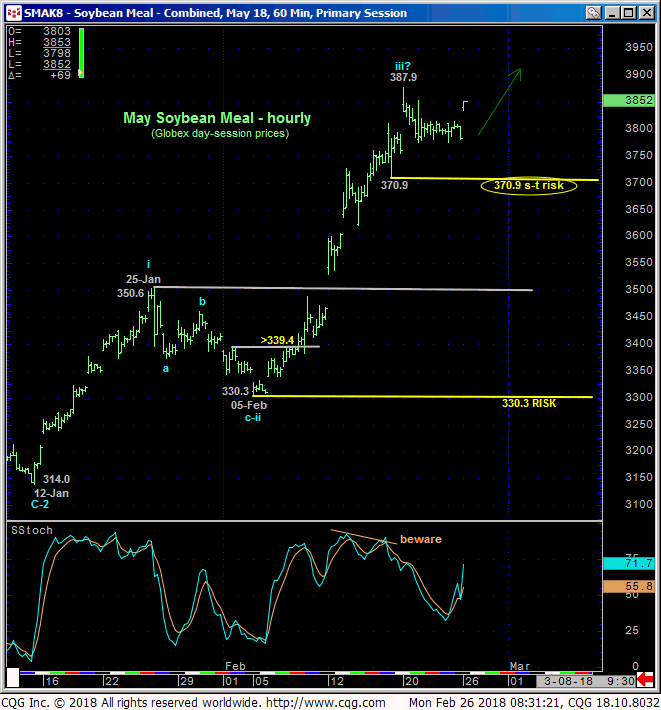
The technical construct and expectations of the now-prompt May meal contract are identical to hose detailed above in beans with 16-Feb’s 370.9 smaller-degree corrective low our short-term risk parameter this market is now minimally required to fail below to defer or threaten a bullish count. In lieu of such weakness setback attempts are still advised to first be approached as corrective buying opportunities ahead of further and possibly accelerated gains.
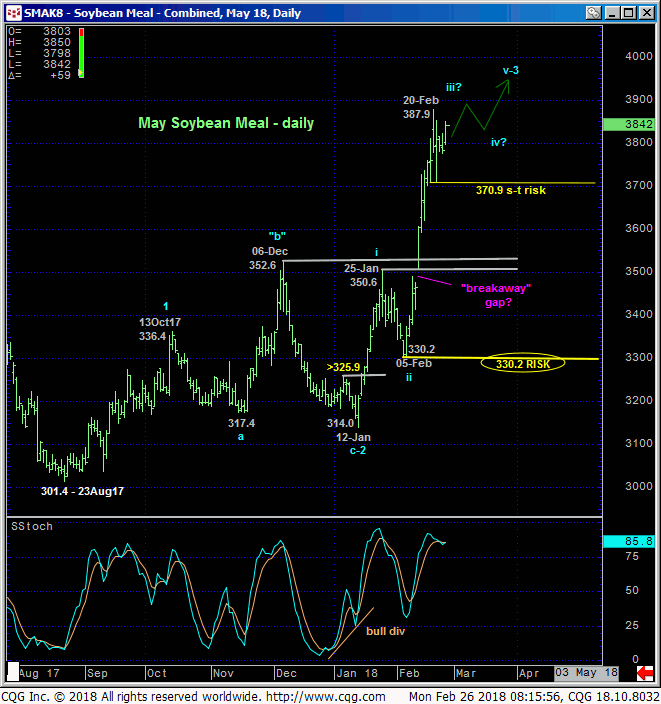
The weekly log active continuation chart below shows the total lack of any technical levels of merit from 12-Feb’s breakout above the entire last year’s 353-area resistance and Jun’16’s 432 high. In effect, there is no resistance. This doesn’t mean we’re forecasting a move to 432 (which we kinda are), but it certainly does mean that until and unless the market stems the clear and present uptrend with a confirmed bearish divergence in momentum below a level like at least 370.9, the market’s upside potential is indeterminable, including a run to or even through that 432 high. Commensurately larger-degree weakness below at least former 353-to-348-area resistance-turned-support and preferably below 05-Feb’s 330.2 larger-degree corrective low is required to threaten or negate this bullish call.
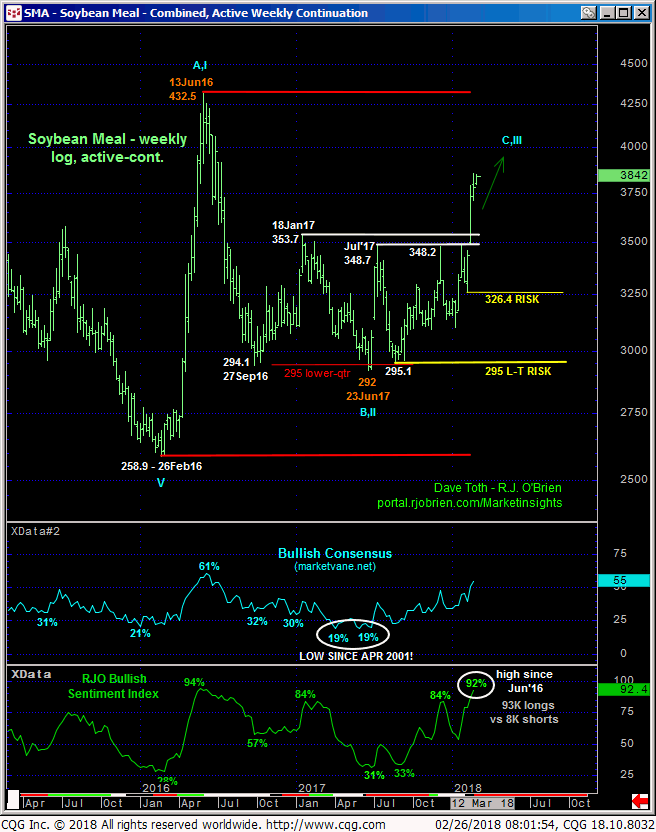
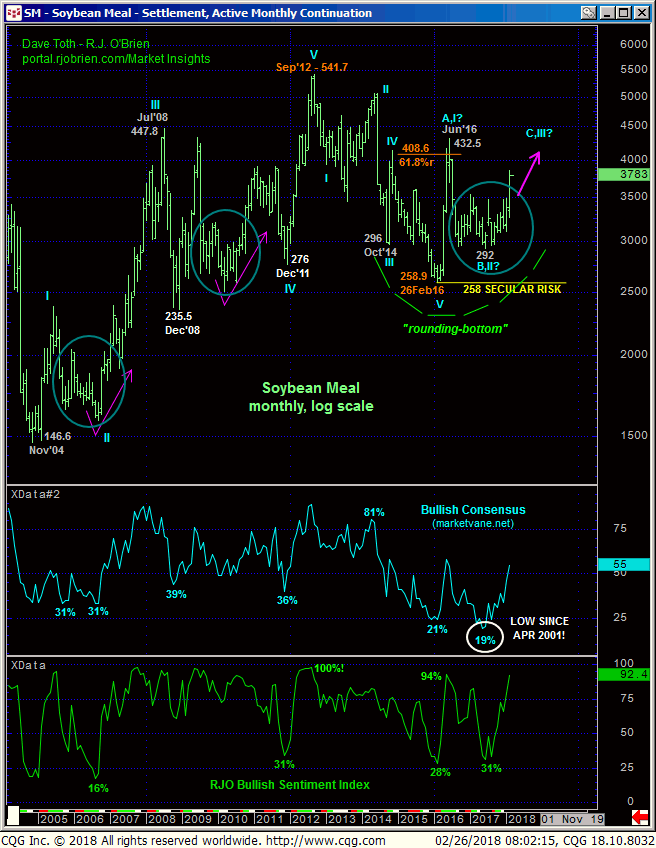
Finally, this month’s spike reinforces our long-term base/reversal count that warns of a major correction or reversal of the entire 3-1/2-year secular bear market from Sep’12’s 541 high to Feb’16’s 258 low. We anticipate an eventual break above Jun’s 432 high before the market fails below 05-Feb’s 330.2 low.
In sum, a bullish policy and exposure remain advised with weakness below 370.9 and/or 330.2 required to threaten or negate this call depending on one’s personal risk profile.
