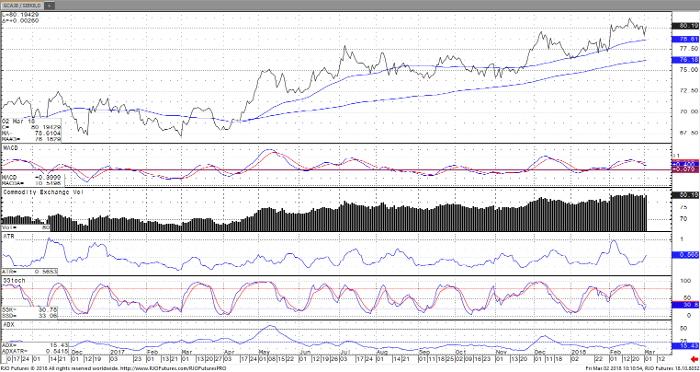
Silver futures continue to baffle the minds of traders with impressive rallies followed by periods of disappointment and head fakes. Its been one of the tougher metals to trade taking its cues from copper and gold. One thing to keep a close eye on is the gold/silver ratio. This ratio measures how many ounces of silver it takes to buy one ounce of gold. Looking over the past two years we can see a steady rise in the ratio indicating that gold has been significantly outperforming silver. Here is the chart of April Gold vs May Silver on a daily basis.

Gold Apr ’18 vs. Silver May ’18 Daily Chart
gold_silver_ratio_chart

Phillip Streible

Early in his career Phillip began trading his own account as a screen trader focusing on the metals, grains and stock indices. He then became a Series 7 licensed financial consultant with A.G. Edwards. Later, he expanded his trading experience into a Series 3 licensed commodity broker with Investment Analysis Group. Most recently he was a senior market strategist at MF Global before joining RJO Futures in October 2011 as a senior commodities broker. As a senior commodities broker his goal is to show clients how to anticipate, recognize and react to bull and bear market conditions through the use of technical analysis techniques that help them to define risk.