APR GOLD
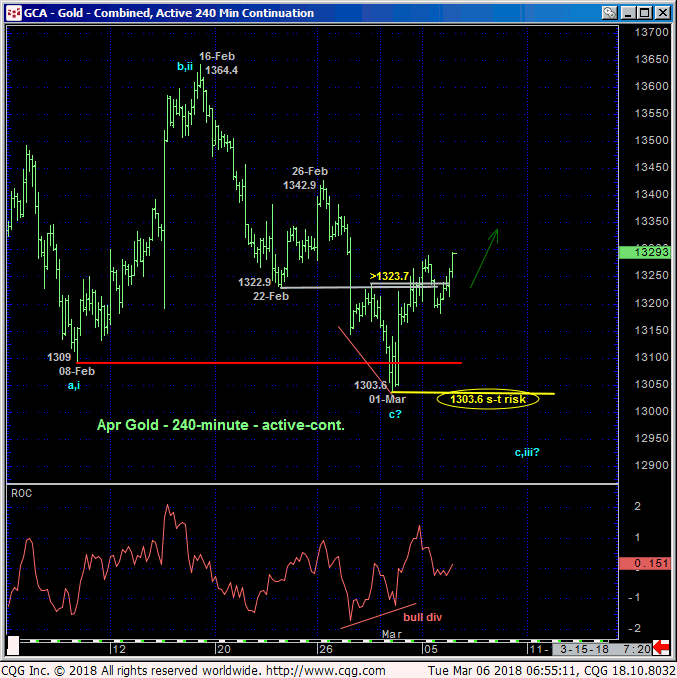
After posting a new low below 08-Feb’s 1309 low as we speculated on in 27-Feb’s Technical Blog, the market’s gross failure to sustain those losses and the past few day’s bullish divergence in short-term momentum above the 1323-area of former support-turned-resistance defines 01-Mar’s 1303.6 low as one of developing importance and possibly the END to a broader 3-wave and thus corrective event down from 25-Jan’s 1365.4 high. If correct, that 1303.6 low serves as the end or lower boundary of this correction and the risk parameter from which a resumed bullish policy can be objectively rebased and managed ahead of a resumption of not only Dec-Jan’s uptrend that preceded it, but also the 15-month uptrend from Dec’16’s 1124 low.
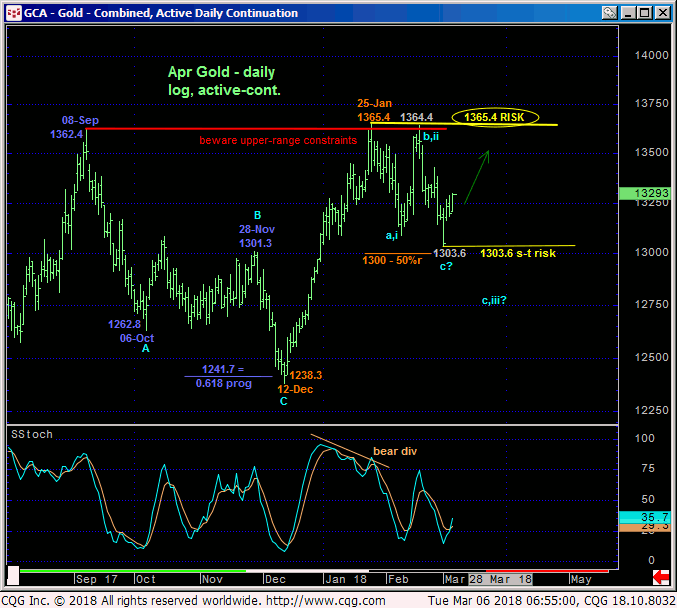
Against the backdrop of Dec-Jan’s trendy, impulsive rally from 1238 to 1365 shown in the daily log chart above, the past five weeks’ sell-off attempt is only a 3-wave affair thus far. Left unaltered by a relapse below 1303.6, this 3-wave setback is considered a corrective/consolidative structure that warns of a resumption of the uptrend that preceded it. The fact that it held the (1300) 50% retrace of that Dec-Jan rally and above general 1300-area resistance-turned-support would seem to reinforce this broader bullish count.
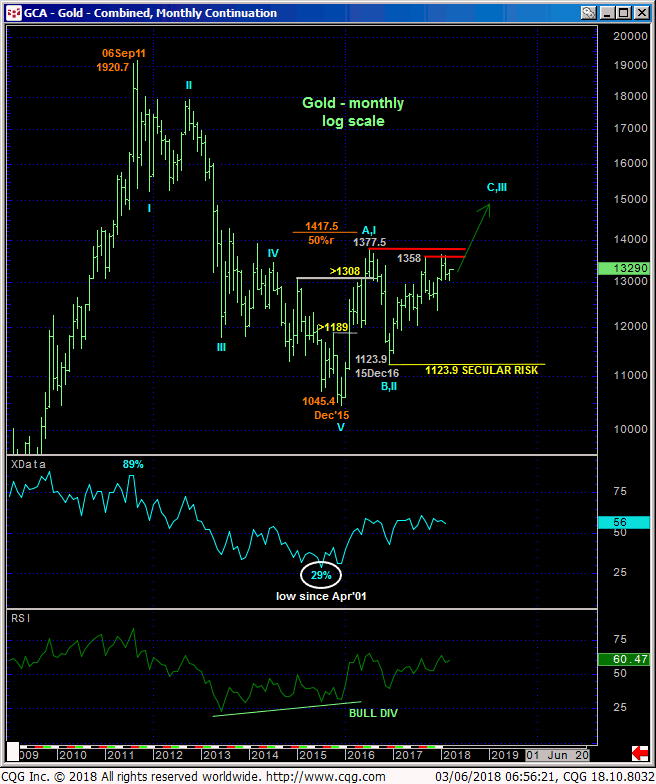
To be sure, the 1365-to-1377-area that has capped this market has major resistance for the past 20 months remains as THE KEY area and condition this market needs to hurdle to reaffirm our long-term bullish count that contends this market is in a new secular bull from Dec’15’s 1045 low. But the assault on this pivotal resistance is now 15 months in the making with setback attempts that are getting more shallow. An eventual bust-out should not come as a surprise. And perhaps the past few days’ recovery is a part of that eventual bust-out.
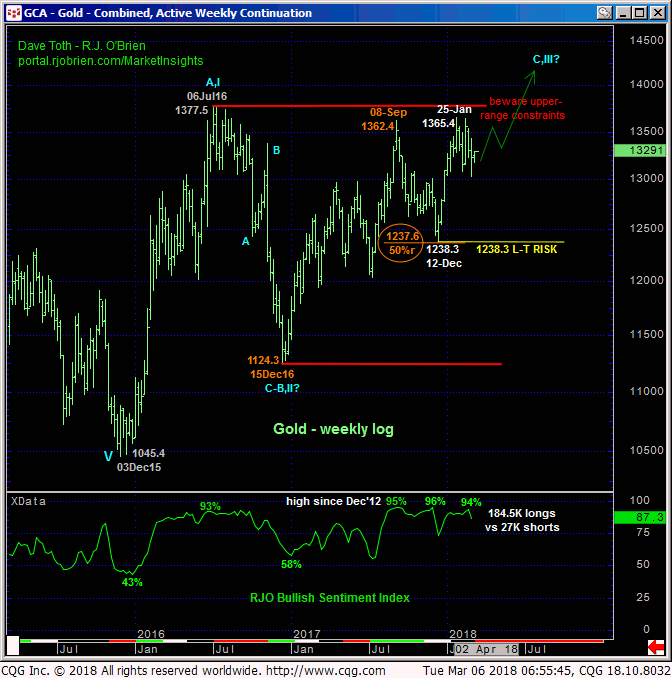
Finally and as we’ve discussed since Feb 2016, we believe that Dec’15’s 1045 low completed the secular bear trend from Sep’11’s 1920 all-time high and that a major correction or reversal of that 4-YEAR bear is intact. This count calls for AT LEAST a (C-Wave) resumption of 2016’s initial counter-trend rally to levels potentially far above 1400. Including the corrective 3-wave appearance to Jan-Feb’s recent sell-off attempt, the market has yet to provide any evidence to threaten this long-term bullish count.
These issues considered, traders are advised to move back to a bullish policy and exposure at-the-market (1330 OB) with a failure below 1303.6 required to negate this call and warrant its cover. 1318 can be used as a micro risk parameter for short-term traders.
MAY SILVER
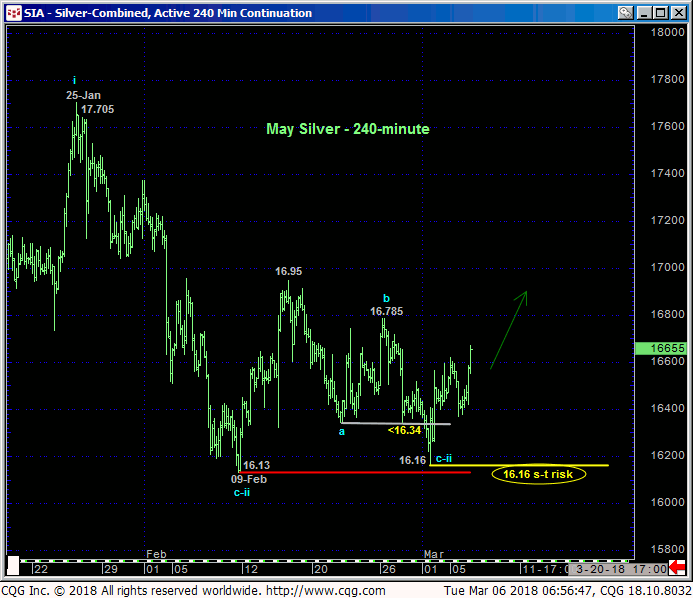
Not surprisingly, a similar bullish count exists in silver to that detailed above in gold. This market has been wallowing around in a much broader, lateral range for the past 15 months however. And here may lie the much greater risk/reward opportunity versus that offered by gold.
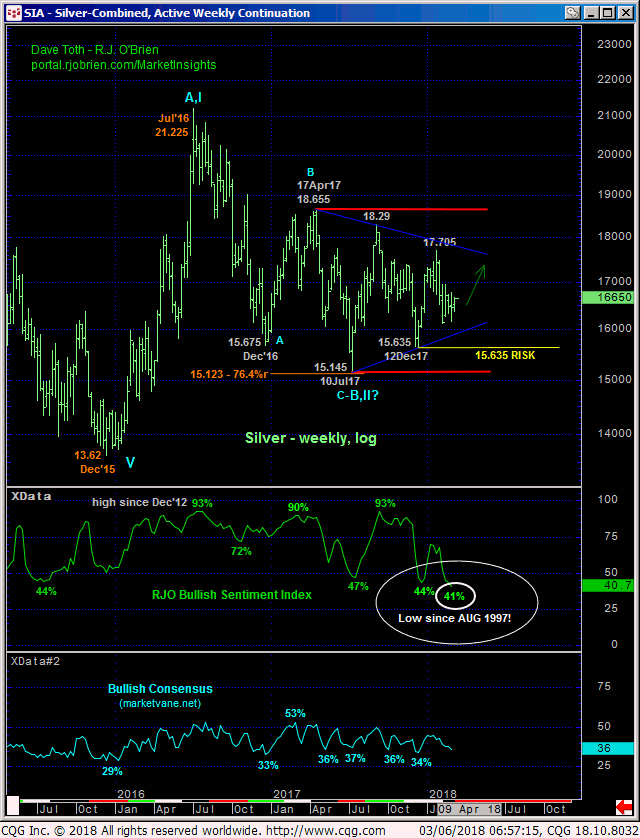
Only a glance at the weekly log active-continuation chart below is needed to see that this market is nowhere near its past year-and-a-half highs. Additionally, the recent intra-range setback from 25-Jan’s 17.705 high has resulted in the erosion to 41% in our RJO Bullish Sentiment Index. This is the lowest, most pessimistic reflection of Managed Money bullish exposure reportable to the CFTC this silver market has recorded since Aug 1997! COMBINED with this market merely languishing in a lateral range that is arguably just a correction of 2016’s initial counter-trend rally, this presents the prospect for what could be a shocker of a rally and resumption of that 2016 uptrend that preceded it.
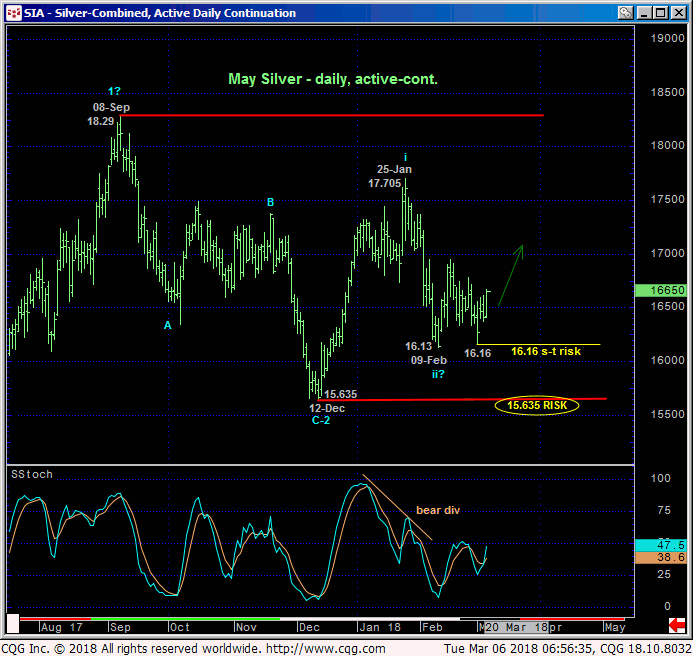
Of course, we cannot conclude a long-term technical event from admittedly very short-term signs of strength like today’s recovery above the past couple days’ highs. But given the market’s recent proximity to the extreme lower recesses of the past month’s range and the lower-quarter of the past six months’ range, we believe the risk/reward merits of even cautious bullish exposure “down here” could be extraordinary given the historic extent to which the Managed Money community has its neck sticking out on the bear side.
These issues considered, traders are advised to move to a cautious bullish policy at-the-market (16.63) with a failure below 16.16 required to negate this specific call. Subsequent strength above 26-Feb’s 16.785 corrective high will reinforce this call and could expose surprising and even long-term gains.
