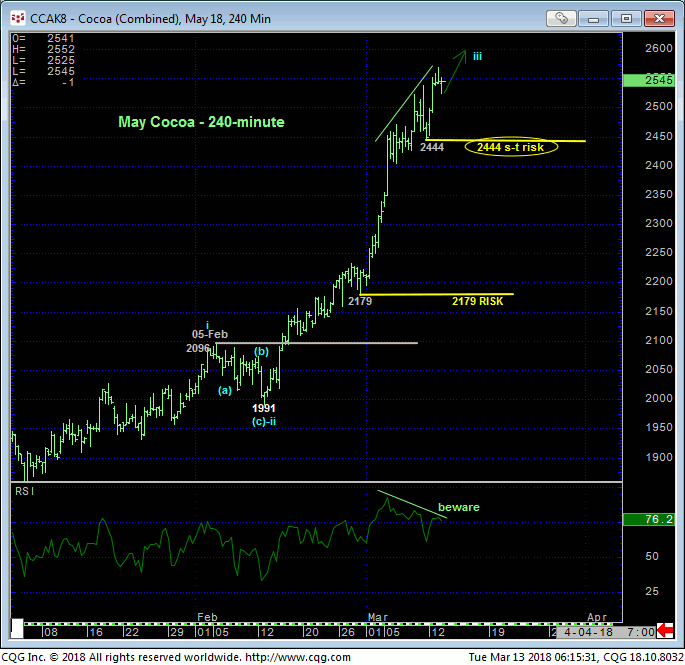
Yesterday’s latest round of new highs for the major uptrend leaves Fri’s 2444 low in its wake as the latest smaller-degree corrective low and new short-term risk parameter from which shorter-term traders with tighter risk profiles can effectively rebase and manage the risk of a still-advised bullish policy and long position from 1900 OB recommended in 03-Jan’s Trading Strategies Blog. As the 240-min chart below shows, weakness below 2444 is minimally required to confirm a bearish divergence in short-term momentum needed to even defer, let alone threaten the clear and present uptrend. In lieu of such weakness further gains remain expected.


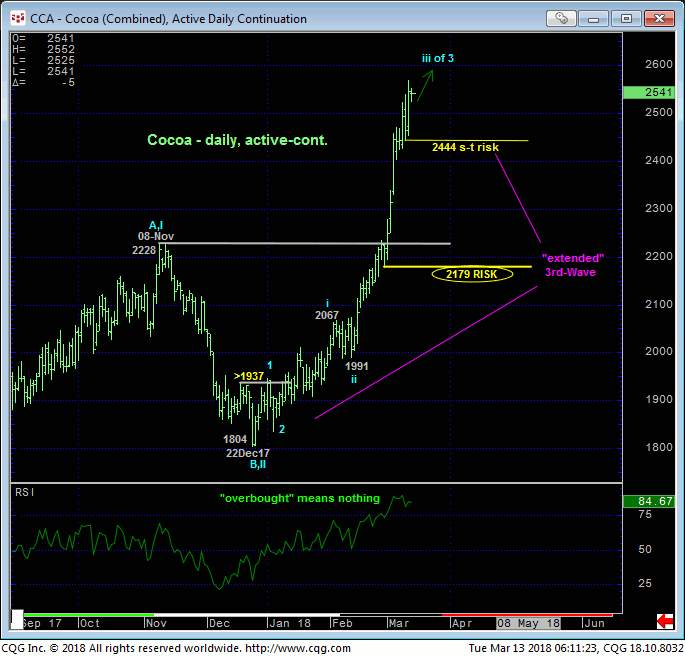
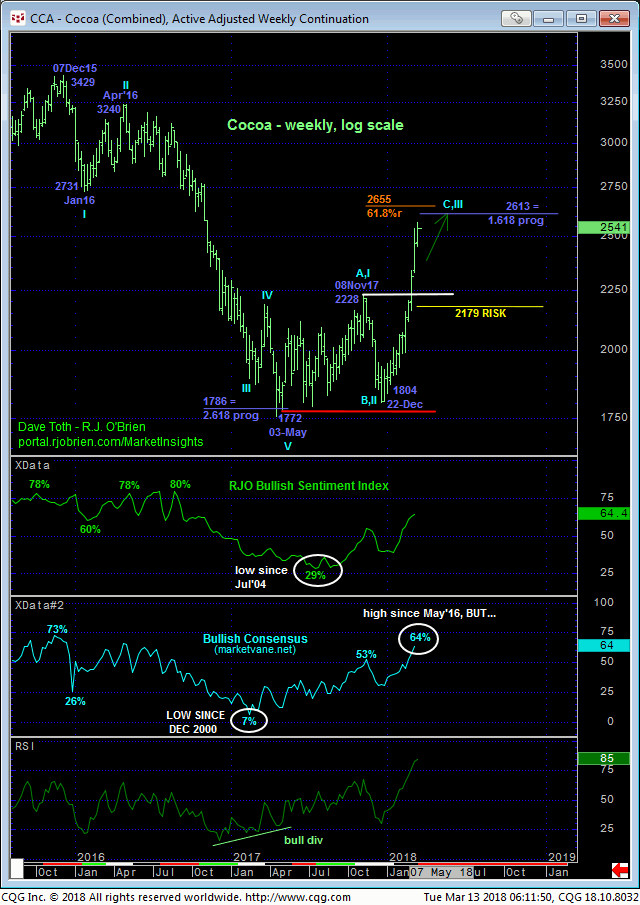
Only a glance at the daily chart above and weekly log chart below is needed to see that the trend is up on all scales with the only levels of any technical merit currently existing only BELOW the market in the forms of prior corrective lows like 2444 on a very short-term scale and former 2228-area resistance from early-Nov as a new support candidate. The only levels that exist above the market are those “derived” from previous price data points like Bollinger Bands, imokus, channel lines, the ever-useless moving averages and even the vaunted Fibonacci relationships we cite often in our analysis.
Indeed, in the weekly log chart below we’ve identified the (2655) 61.8% retrace of the entire Dec’15 – May’17 decline from 3429 to 1772 and also the (2613) 1.618 progression relationship of May-Nov’17’s initial 1772 – 2228 rally from 22-Dec’s 1804 low. But such derived levels never have been a reliable reason to speculate on a trend’s end in the absence of an accompanying bearish divergence in momentum, and they never will. This is true of EVERY derived technical indicator available to techies on every data vendor. The derived indicator “tail” never, ever wags the underlying market “dog”. This is also why references to a market being “overbought” are useless, irresponsible and outside the bounds of technical discipline. This market should be expected to remain on its upward tangent, quite simply, until and unless it fails below a prior corrective low like 2444.

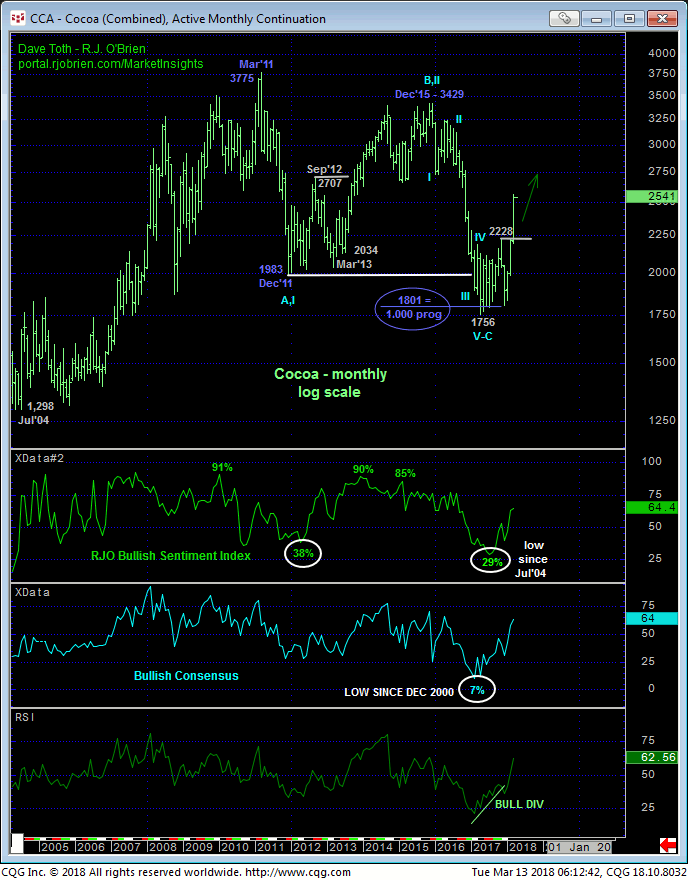
Finally, on an even longer-term basis, the monthly log scale chart below shows that the extent of this month’s rally, in fact, breaks the secular bear trend from at least Dec’15’s 3429 high, exposing at least a major correction of his decline. Given the 3-wave and thus corrective appearance of the broader sell-off attempt from Mar’11’s 3775 high however, we cannot rule out a resumption of the 7-year uptrend from 2004’s 1298 low to 2011’s 3775 high that preceded the 6-year, 3-wave decline.
These issues considered, a bullish policy and exposure remain advised with a minimum failure below 2444 required to even defer the bull and expose what would likely be an interim correction ahead of resumed and potentially major gains. Shorter-term traders with tighter risk profiles are advised to exchange whipsaw risk for larger nominal risk and take profits on longs from 1900 on a failure below 2444. Long-term players would be advised to maintain a long position with commensurately larger-degree weakness below at least 2228 required to threaten this call enough to warrant its cover. In lieu of such weakness we anticipate further and possible accelerated gains even from “up here”.


