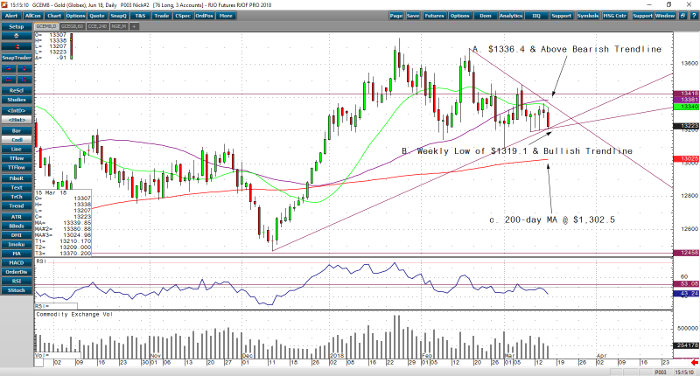
For Thursdays trade, June gold saw little movement and traded within a tight $13 range. However, it traded down about $9 and extended its two-day selloff and is still trading in a tight range over the last two weeks. Once again, the dollar traded higher Thursday, which has largely kept gold in check and preventing it from rallying to higher prices. The gold bulls and bears will keep a close watch on the US dollar or any kind of trade war brewing to see what direction the shiny one will pick next. Furthermore, with the new Chief Economic Advisor Larry Kudlow joining the Trump Administration this week, whom favors a strong US dollar, gold might find further difficulties in finding higher prices for the time being.
If we take a quick look at the daily June gold chart, we can pick from some good technical levels to help us with the next direction of the market. If gold breaks above this week’s high that is also above a bearish trendline, then look for a rally to the February 16 high of $1,369.6, which was the start of this trendline. If gold trades below this week’s low of $1,319.1, then look for a selloff to at least the 200-day MA, which is currently at $1,302.5. I highlighted all these levels below on my RJOF PRO daily June gold chart.
Gold Jun ’18 Daily Chart


