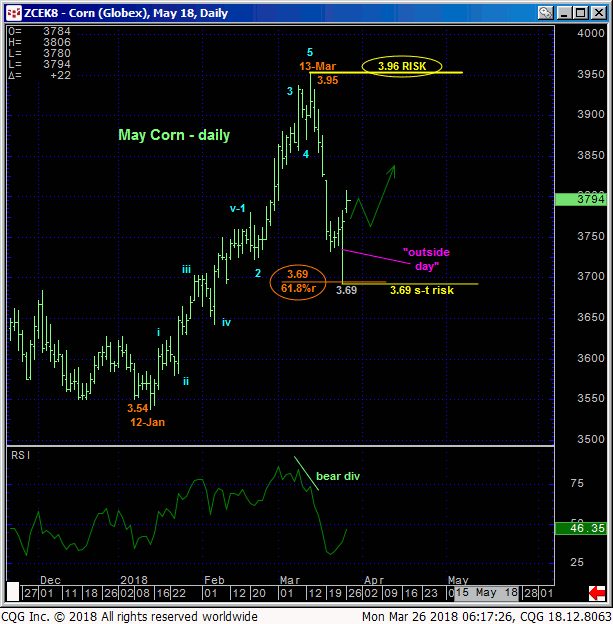
In 15-Mar’s Technical Webcast we discussed the matter of technical and trading SCALE with respect to navigating the correction-vs.-reversal dilemma following that day’s bearish divergence in short-term momentum. The daily chart below shows that the subsequent fallout was relatively steep, quickly correcting exactly 61.8% of Jan-Mar’s 3.54 – 3.95 rally in the May contract. But as we’ll discuss below, relative to the broader 4-month rally on an active-continuation chart basis, the past couple weeks’ sell-off attempt falls well within the bounds of a mere correction within a broader uptrend that could be major in scope.

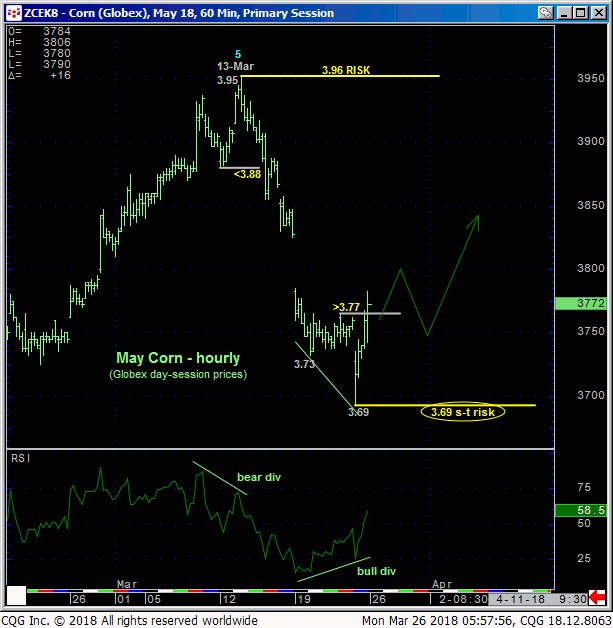
Importantly, the hourly chart below shows that Fri afternoon’s recovery above Thur’s 3.77 corrective high confirms a bullish divergence in short-term momentum. This identifies Fri’s 3.69 low as one of developing importance and possibly the END of the decline from 13-Mar’s 3.95 high. The fact that this level is the exact 61.8% retrace of Jan-Mar’s 3.54 – 3.95 rally shown in the daily chart above and that Fri produced an “outside day” (higher high, lower low and higher close than Thur’s range and close) would seem to contribute to the importance of Fri’s 3.69 low. Per such we are considering 3.69 our new short-term risk parameter from which non-bearish decisions like short-covers and cautious bullish punts can now be objectively based and managed. Heading into Thur’s huge crop report, the risk/reward merits of basing bullish decisions around this specific low and risk parameter could prove outstanding.
We will present a call diagonal strategy tomorrow using the CME’s short-dated option on new crop corn that provide an acute risk/reward opportunity for bulls.


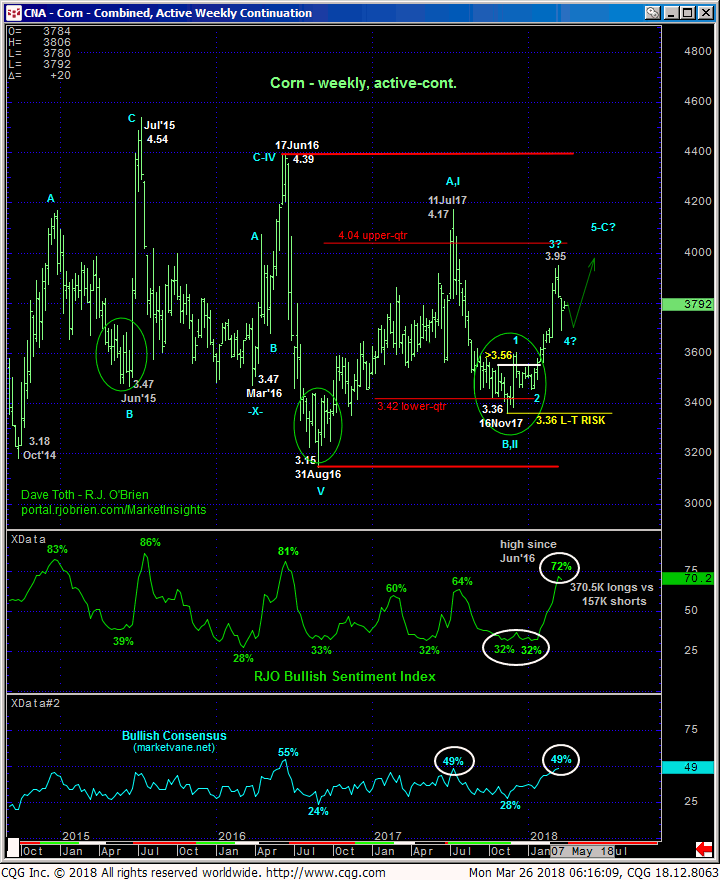
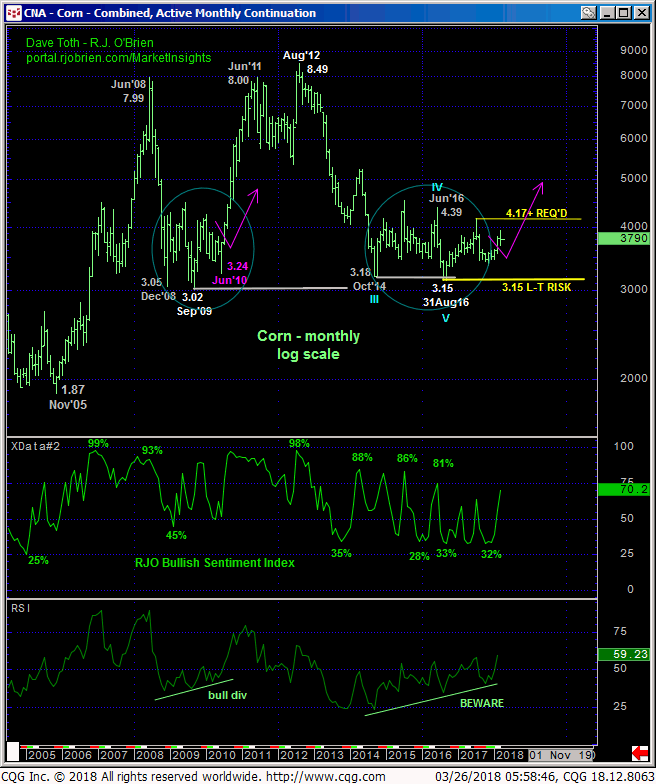
The weekly log active-continuation chart above shows the base/reversal-threat arguably still unfolding from last Nov’s 3.36 low within the context of a our major, multi-year base/reversal count labeled in the monthly log chart below. We’ve discussed for many quarters now the similarities of the bottoming price action since Oct’14’s 3.18 low to those that followed Dec’08’s 3.05 low. And while commensurately larger-degree strength above Jun’17’s 4.17 high remains required to confirm this call, the market has yet to provide any evidence even close to that required to threaten this count.
Admittedly, the market’s position only back to the middle of the incessant 3-1/2-year lateral range amidst a return to relatively historically bullish sentiment may be threats or deferrals to this broader bullish count. Near-term gains suggested above followed by a relapse below Fri’s 3.69 low would reinforce such a deferral. But until at least such sub-3.69 weakness is proven, we believe odds have swung back in favor of the bull after a correction that provides a preferred and favorable risk/reward opportunity from the buy side.
These issues considered, traders are advised to first approach setback attempts to 3.74 OB as corrective buying opportunities with a failure below 3.69 required to negate this call and expose further intra-range losses. In lieu of such sub-3.69 losses we anticipate at least a more extensive correction to the past couple weeks’ 3.95 – 3.69 swoon and very possibly a resumption of the major uptrend to new highs above 3.95.


