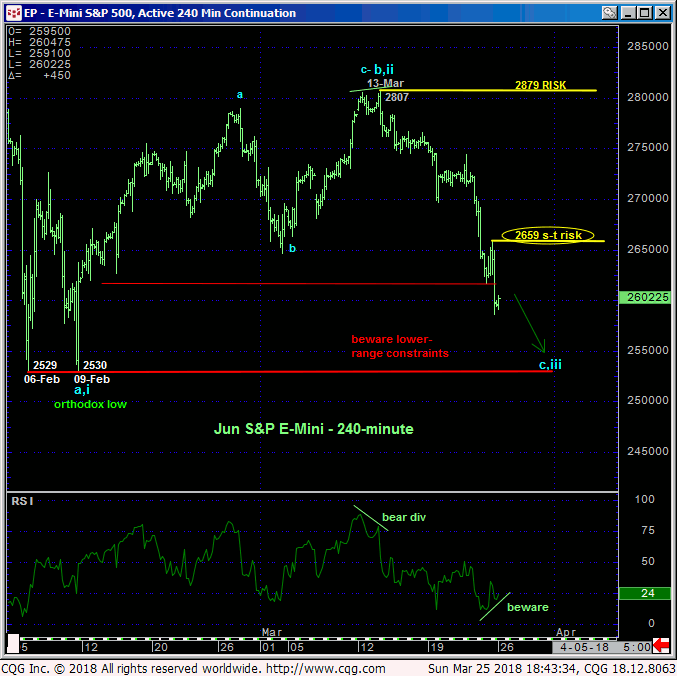
In 15-Mar’s Technical Blog following 13-Mar’s bearish divergence in momentum from the upper-quarter of the past couple months’ range we discussed not only further lateral-to-lower consolidation, but the likelihood of a sharp, emotional (c-Wave) continuation of a suspected correction from 29-Jan’s 2879 all-time high. Thur and Fri’s losses are according to this script. And now that the market has broached the lower-quarter of the past couple months 2879 – 2530-range, traders are advised to beware the countering bullish divergence in momentum needed to not only arrest this decline, but potentially re-expose the secular bull market.
Only a glance at the 240-min chart below is needed to see that 1) the trend is clearly down and 2) that the POTENTIAL for a bullish divergence in momentum is developing. Fri afternoon’s resumption of the slide has identified Fri’s 2659 high as the latest smaller-degree corrective high and new short-term risk parameter this market is now required to sustain losses below to maintain a more immediate bearish count. Its failure to do so will CONFIRM this divergence to the point of non-bearish action like short-covers and cautious bullish punts. In lieu of such 2659+ strength further losses remain expected, and potentially to levels below 09-Feb’s 2530 orthodox low.


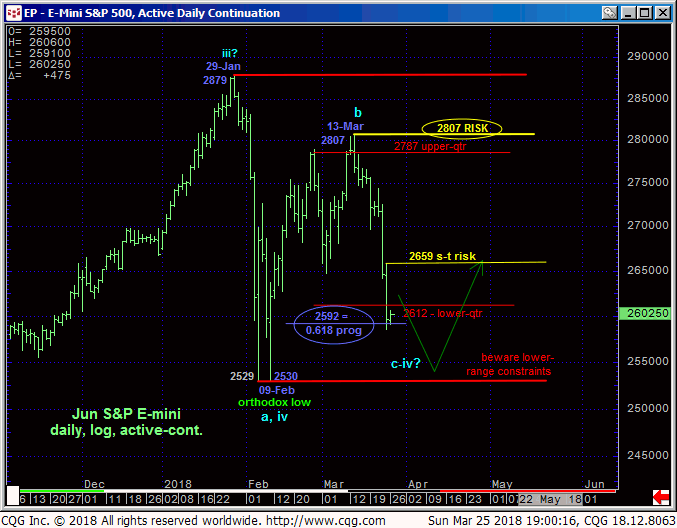
The daily log chart above shows the market’s engagement of the lower-quarter of the 2-month range. The prospective (c-Wave) “end” to the correction from 29-Jan’s 2879 high does not have to end above the 2530 low and, indeed, can easily break it and remain well within the context of a mere correction within the secular bull and an eventual outstanding buying opportunity.
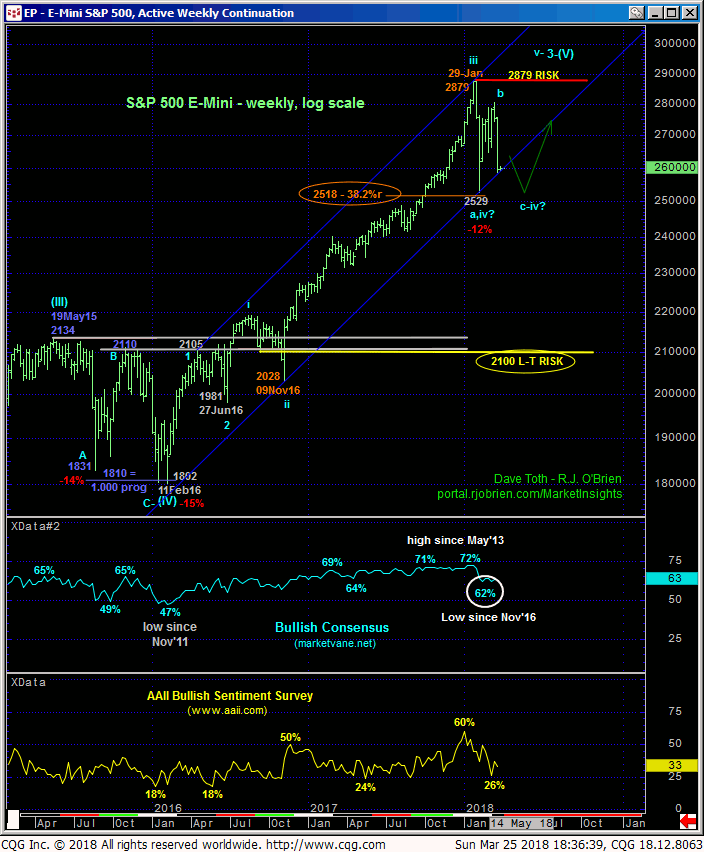
This is exactly what happened with the (C-Wave) end of the correction that began with 19May15’s 2134 high shown in the weekly log chart below. The countering B-Wave rebound to 2110 severely tested the 2134 high before the sharp, emotional C-Wave plunge to Feb’16’s 1802 low AND break of Aug’15’s 1831 low turned the huddle-masses consensus decidedly bearish, right into the major correction’s END and resumed secular bull’s start and outstanding buying opportunity.
But does the market HAVE to more severely test or break 09-Feb’s 2530 low? Not necessarily. Bullish sentiment has already eroded to levels that could easily warn of and accompany the end of another interim correction. And another look at the daily log chart above shows that the relapse from 13-Mar’s 2807 high has spanned a length within six points of its (2592) 0.618 progression of Jan-Feb’s preceding sell-off from 2879 to 2530. IF the market stems the recent slide with a confirmed bullish divergence in mo above 2659, the correction from Jan’s high could be over and the secular bull could be resuming.

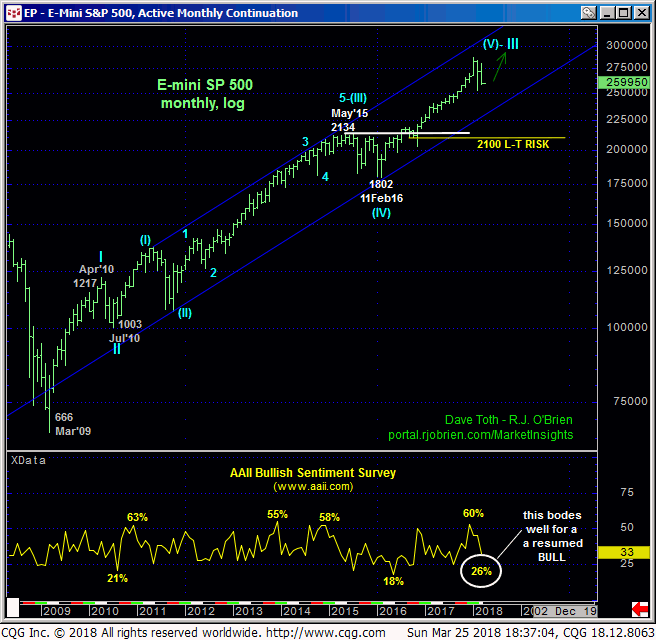
Despite all of the fundamental hyperbole of the past couple months that brought us to this point, the monthly log scale chart below shows that this 2-month correction is only similar in scope to intra-uptrend corrections from Feb’16’s 1802 low. The May’15 – Feb’16, Aug-Nov’16 and Apr-Jul’10 corrections were all much larger than the 12% correction that has unfolded thus far. Nonetheless, until this market recoups at least 2659 and especially 13-Mar’s 2807 high and key long-term risk parameter, further and possibly sharp losses should not surprise, to or even below 09-Feb’s 2530 low. The moment the market stems this slide with a bullish divergence in even short-term mo however, the risk/reward merits will swing around to the buy side for the possible resumption of the secular bull market.


