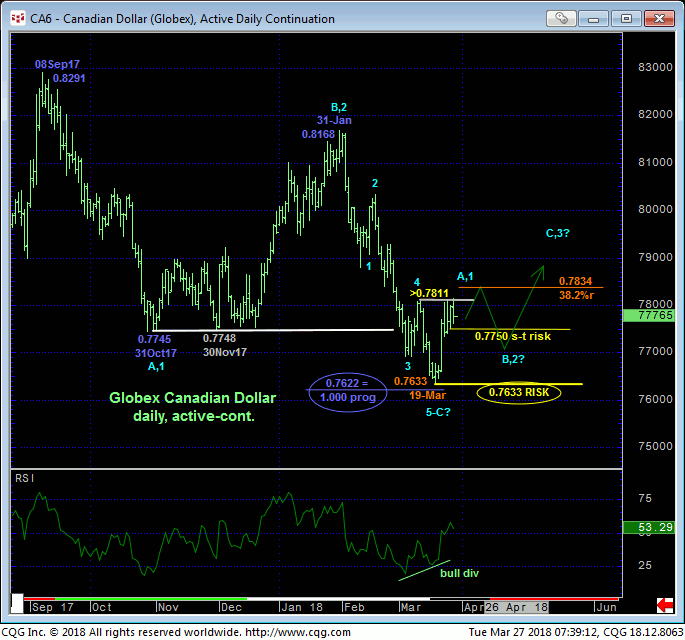
In 15-Mar’s Technical Webcast we identified 12-Mar’s 0.7811 corrective high as the key corrective and risk parameter this market needed to sustain losses below to maintain a broader bearish count. The market’s poke above this level overnight- as minor as it was- confirms a bullish divergence in momentum that leaves 19-Mar’s 0.7633 low in its wake as the prospective END to not only a textbook 5-wave Elliott sequence down from 31-Jan’s 0.8168 high, but a broader 3-wave decline from 08Sep17’s 0.8291 high as labeled in the daily active-continuation chart below.
Left unaltered by a relapse below 0.7633, this 3-wave, 6-MONTH decline is arguably a corrective structure that warns of a resumption of 2016-17’s major uptrend that preceded it. Minimally however, a correction of Feb-Mar’s 0.8168 – 0.7633 decline is expected in the weeks ahead, the Fibonacci minimum 38.2% retracement of which cuts across at 0.7834.

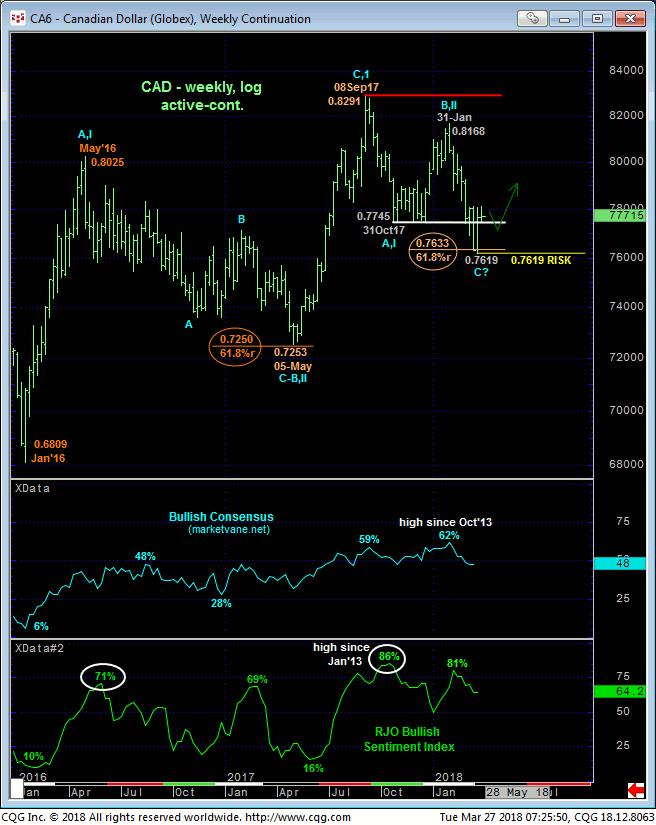
The 3-wave structure to the decline from last Sep’s 0.8291 high is clear in both the daily chart above and weekly log chart below. And we find it very interesting that 19-Mar’s 0.7633 low in the now-prompt Jun contract is the exact 61.8% retrace of May-Sep’17 rally from 0.7253 to 0.8291 on a weekly log active-continuation chart below. The 0.7619 low referenced for that date was per the previous Mar contract. It’s also noteworthy in the daily chart that the (0.7622) 1.000 progression of Sep-Oct’s initial 0.8291 – 0.7745 decline from 31-Jan’s 0.8168 high came within 11 points of 19-Mar’s 0.7633 low in the Jun contract and only thee points away from the 0.7619 low in the Mar contract.
These Fibonacci relationships are astounding. Especially on the heels of a confirmed bullish divergence in momentum and arguably complete Elliott sequence down, these Fib relationships contribute to a BASE/reversal environment that could be major in scope.

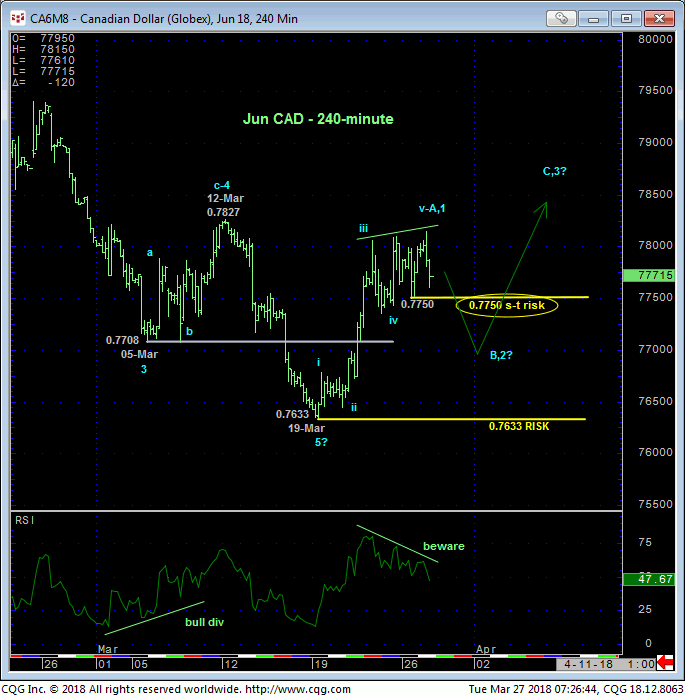
As a market that’s getting its brains bashed in for months rarely just turns on a dime and doesn’t look back, we anticipate a (B- or 2nd-Wave) correction to the past week’s rally somewhere along the line. The 240-min chart below an impulsive-looking initial rally (key to a prospective new bullish count) as well as waning upside momentum. A failure below yesterday’s 0.7750 minor corrective low and short-term risk parameter will stem the recent recovery and expose a corrective relapse and test of 19-Mar’s low that we believe could present one of the more favorable risk/reward buying opportunities of the year where traders may be looking at exchanging scalper’s risk for a long-term pay-off.
These issues considered, all previously recommended bearish policy and exposure have been advised to be neutralized. Furthermore, we will be watchful for an interim correction somewhere along the line to move to a new bullish policy that we believe could produce surprising gains in the weeks and perhaps even months ahead with a failure below 0.7633 now required to negate this base/reversal call.


