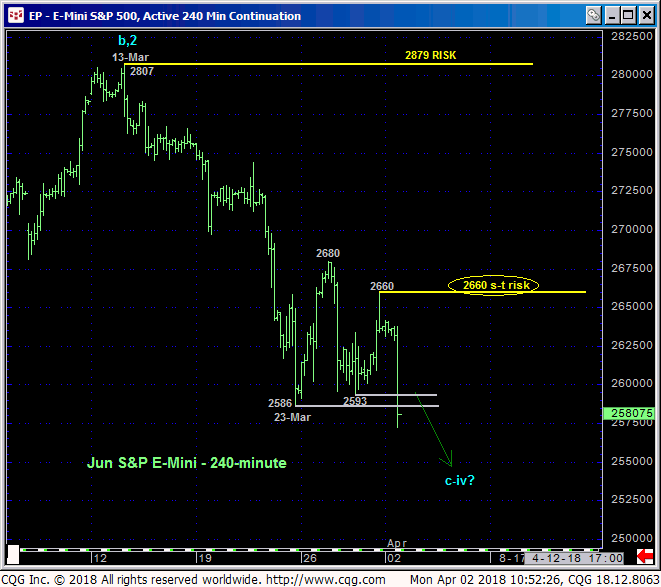
Today’s clear break below the past week’s 2593-to-2586-area support reaffirms the corrective count introduced in 15-Mar’s Technical Blog and leaves Fri’s 2660 high in its wake as the latest smaller-degree corrective high this market is now minimally required to recoup to stem the clear and present downtrend. In this regard 2660 becomes our new short-term risk parameter to an interim bearish count with former 2586-to-2593-area support expected to hold as new resistance if the market has a broader bearish count in mind.

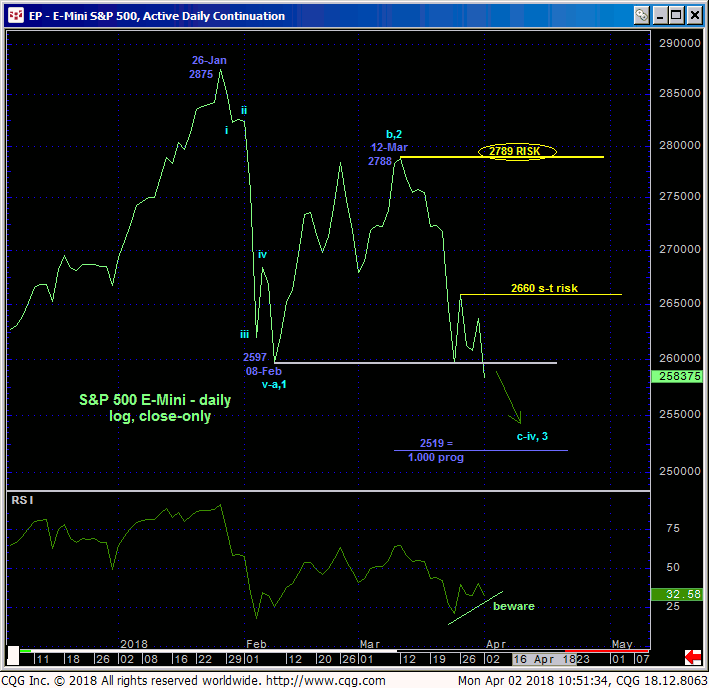
The daily log close-only chart below shows the developing POTENTIAL for a bullish divergence in momentum, but this indicator won’t be considered CONFIRMED to the point of non-bearish action until and unless it fails to sustain new lows via a recovery above 2660. In lieu of such 2660+ strength the market’s downside potential is indeterminable and potentially extreme.


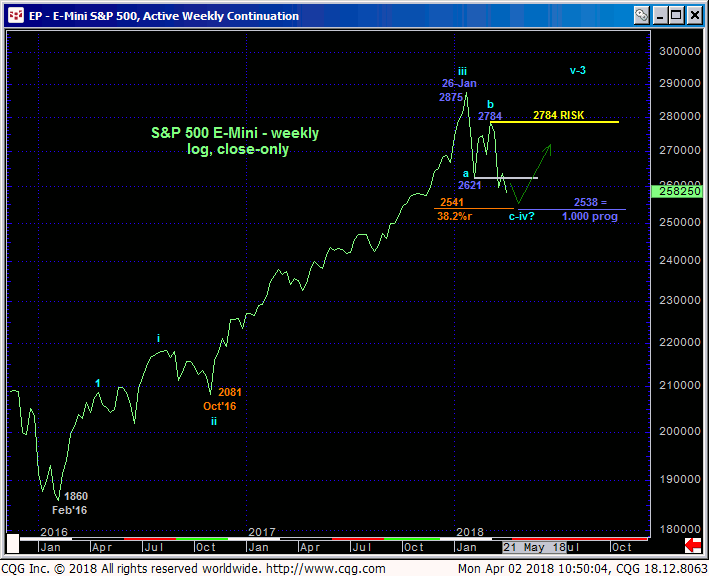
On a weekly log close-only basis above it’s interesting to note that the (2541) 38.2% retrace of the (suspected 3rd-Wave) rally from last Oct’s 2081 low to Jan’s 2875 high cuts across within a mere three points of the (2538) 1.000 progression of Jan-Feb’s initial 2875 – 2621 counter-trend break from 09-Mar’s 2784 reactive high. Against the backdrop of the secular bull market that suggests the past couple months’ relapse is just another correction, we will be watchful for the countering bullish divergence in momentum from this 2540-area to arrest the slide and expose a favorable risk/reward opportunity from the bull side.
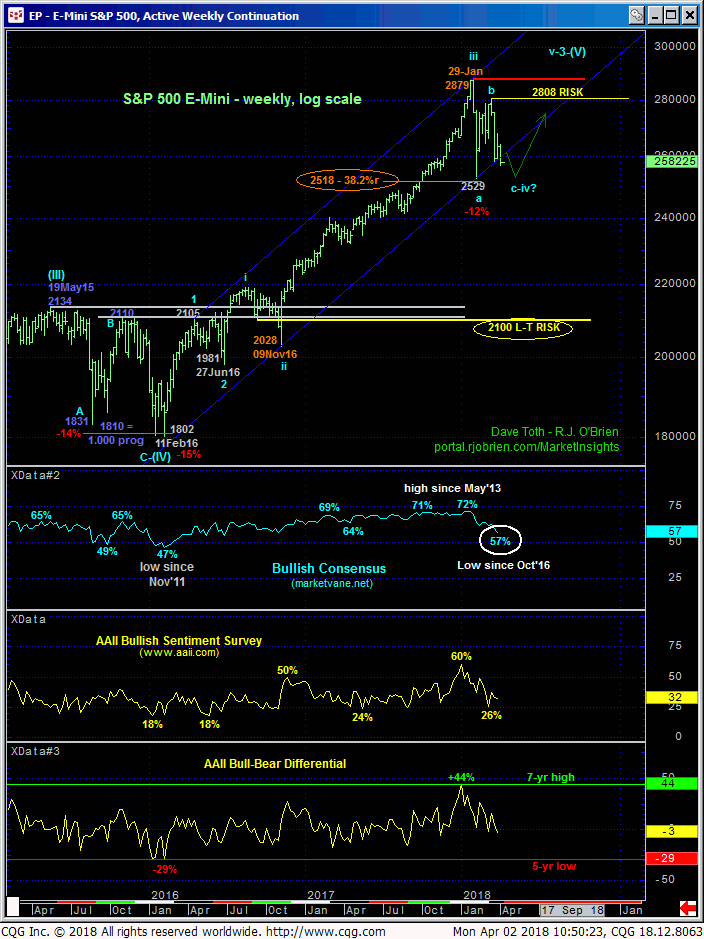
Per the prospective navigation of the end of a broader correction, it’s interesting to note in the weekly log chart below that market sentiment levels have deteriorated to levels that have warned of and accompanied such bull market correction ends in the past. Nonetheless however, a confirmed bullish divergence in momentum remains required to stem the reaffirmed downtrend and reject/define a more reliable low and support from which a resumed bullish policy can only then be objectively based and managed. Currently and minimally this would require a recovery above 2660. In lieu of such strength further losses remain expected.


